Live Cell Imaging Market Snapshot

Key Players

  • Leica Microsystems (Germany)
  • Nikon Corporation (Japan)
  • Olympus Corporation (Japan)
  • PerkinElmer (US)
  • GE Healthcare (US)
  • Carl Zeiss AG (Germany)
  • Bruker Corporation (US)
  • Thermo Fisher Scientific Inc (US)
  • Beckman Coulter Inc (US)
  • Molecular Devices LLC (US)

Market Size

Base Year 2024
$3.19 Bn
CAGR
9.04%
Forecast 2034
$7.58 Bn

Market Segments

By Product
Equipment, Consumables, Software
By Technology
Fluorescence Recovery After Photobleaching (FRAP), Total Internal Reflection Fluorescence Microscopy (TIRF), High-Content Analysis, Fluorescence In Situ Hybridization (FISH)
By Application
Drug Discovery, Cell Biology, Others
By End User
Pharmaceutical Companies, Hospitals, Biotechnology Companies

Market Dynamics

Drivers
  • Technological advancements in imaging
  • Rising pharmaceutical R&D funding
Restraints
  • High equipment costs
  • Complex operation processes
Opportunities
  • Technological advancement in imaging techniques
  • Growing pharmaceutical and biotechnology industries

Market Size

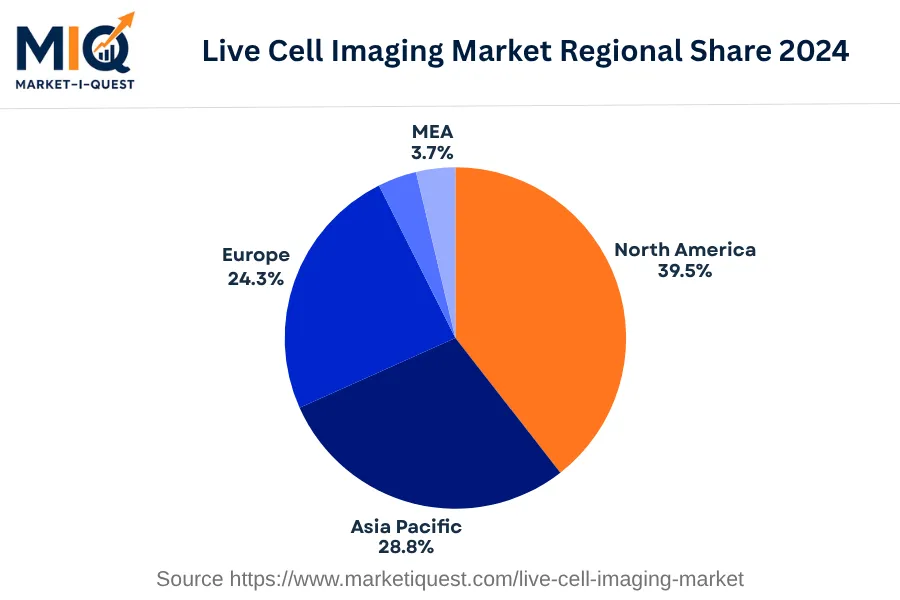
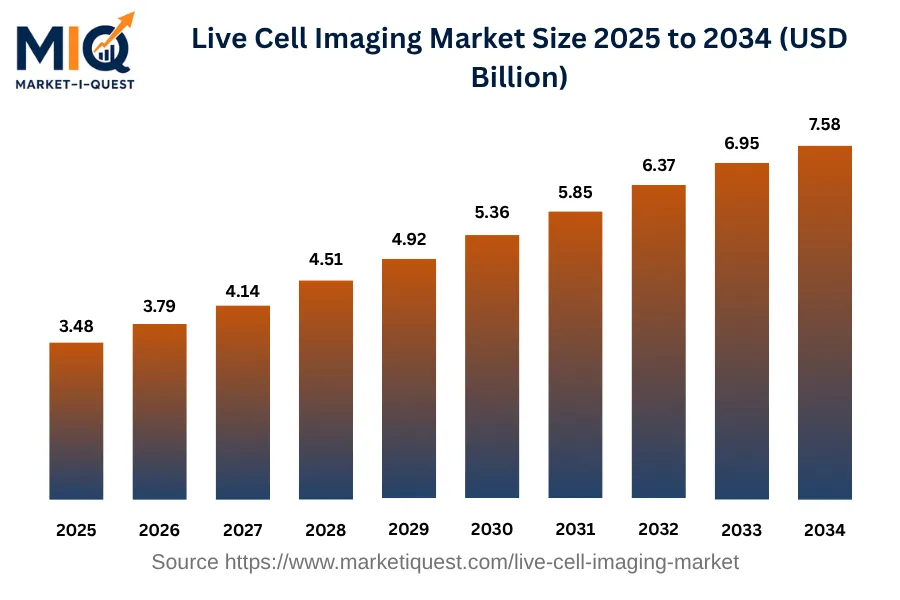
The Live Cell Imaging Market size in 2025 is projected to be $3.48 billion, up from $3.19 billion in 2024. By 2034, the market size is expected to nearly double to $7.58 billion, exhibiting a CAGR of 9.04%. This growth in the Live Cell Imaging Market over the decade from 2025 to 2034 reflects the increasing adoption and developments in the technology that are expected to continuously stimulate market growth. Enhancements in this technology allow for more efficient and precise imaging, which is invaluable in a variety of scientific and medical applications. In terms of regional share in 2024, North America held the majority share at 39.5%, followed by Asia Pacific at 28.8%, Europe at 24.3%, and similar proportions in the LATAM and MEA regions, both around 3.7%.

Key Takeaways

  • By Product - Equipment led the segment accounting for the dominant share in the Live Cell Imaging Market.
  • By Technology - Fluorescence Recovery After Photobleaching (FRAP) held the significant share in the market segment.
  • By Application - Drug Discovery was the leading subsegment in the Live Cell Imaging Market.
  • By End User - Biotechnology Companies grew fastest accounting for a prominent position in the market.
live-cell-imaging-market market size

Key Driving Factors

Adoption of High-content Screening Techniques in Drug Discovery

The pharmaceutical industry's progression towards the adoption of high-content screening techniques in drug discovery is a significant driver in the live cell imaging market. High-content screening techniques provide robust, quantitative analysis of live cells, enabling more efficient, detailed studies of drug effects on cellular morphology and function. Live cell imaging, being key to these techniques, sees its demand surge as more and more pharmaceutical firms implement high-content screening in their research and development processes. The increasing prevalence of complex diseases like cancer is further leading to more bio-pharmaceuticals being developed, therefore amplifying the need for high-content screening techniques and, indirectly, live cell imaging systems.

Rising Preferences for Non-invasive Diagnostic Procedures

The medical field is witnessing a marked shift towards non-invasive diagnostic procedures, which is a key driver for the live cell imaging market. Traditional invasive diagnostic procedures often result in discomfort and complications for patients, prompting medical professionals to lean towards non-invasive methodologies. Live cell imaging aids in non-invasive diagnostics by providing real-time visualization of cellular processes. This reduces the need for physical biopsies or tissue sampling, making diagnostic procedures safer and more comfortable for patients. Healthcare providers are more frequently prioritizing these non-invasive procedures, thus bolstering the market for live cell imaging technology.

Market Evolution by Timeline

2019-2023
During this time, the primary demand for live cell imaging technology was largely in North America, driven by buyers in biotechnology and pharmaceutical firms, specifically those involved in oncology research. Companies introduced more integrated platforms, but challenges in data management and imaging speed remained unresolved. Regulations required to ensure ethical handling of live cells (e.g., Animal Welfare Act, U.S.) influenced adoption rates. Commercial models entailed conventional, up-front payment for instruments, with methods such as lease-to-own gaining initial traction. High cost of instruments stood as a chief deterrent, and responses included the exploration of more affordable, compact designs.
2024
By 2024, universities and research institutions across Europe showed increased interest due to their expanding cellular and genetic studies. Products diversified with more HD imaging capacity and faster data processing. The EU's General Data Protection Regulation (GDPR) had reaching effects on data handling, possibly affecting rate of adoption. Flexible payment models became more available, with usage-based pricing seeing respective uptake given the high investment stakes. Companies faced with integration challenges had to revisit their technology infrastructure.
2025-2029
From 2025 to 2029, Asia-Pacific jurisdictions showcased escalating demand due to rise in clinical applications and government initiatives encouraging stem-cell research, such as Japan's Regenerative Medicine Law. More products were able to function in complex, multimodal research environments, yet constraints in terms of automating the handling of live cells manifested. Policies around artificial intelligence's role in data handling affected technology adoption and commercial models, likely introducing a move towards pay-per-use contracts. Suppliers were necessitated to invest in product innovation to overcome extant automation limitations.
2030-2034
Between 2030 and 2034, demand from Latin America burgeoned, particularly within growing genetics and molecular biology fields. Shipment of largely automated platforms capable of high-frequency imaging marked a significant deviation in supply. Regulations around privacy of genomic data, like the Genetic Information Nondiscrimination Act, U.S., influenced procurement. A shift towards long-term leasing contracts with maintenance and upgrade provisions became typical, as buyers sought to mitigate technological obsolescence risk. Product reliability emerged as a critical demand parameter given the longer lease tenures.

Future Market Outlook

Future Opportunities

The live cell imaging market is poised to benefit from several emerging trends, particularly in the areas of personalized medicine and drug discovery. In 2024, the National Institutes of Health launched initiatives focused on the applications of live cell imaging to better understand cancer biology, emphasizing the need for improved imaging technologies in therapeutic contexts. Additionally, with the rise of targeted therapies, pharmaceutical companies are increasingly looking to integrate live cell imaging into clinical trials, allowing for real-time monitoring of cellular responses to treatments. Regions like North America and Europe are leading this trend, with regulatory guidelines evolving to encourage the use of live cell imaging in preclinical and clinical settings. Moreover, advances in artificial intelligence are enhancing the capabilities of live cell imaging systems by enabling more sophisticated image analysis and interpretation. Companies such as Thermo Fisher Scientific have initiated projects aimed at integrating machine learning algorithms with existing imaging platforms, slated for commercial availability in late 2024. These developments are likely to foster greater collaboration between technology firms and academic institutions, spurring innovation in imaging techniques and applications. As the emphasis on precision health and targeted therapies continues to grow, the need for cutting-edge live cell imaging technologies will create substantial opportunities for growth in various sectors, including biopharmaceuticals and academic research.

Segmentation Analysis

By Product

The market is divided into subsegments including equipment, consumables, and software. Equipment accounted for the largest revenue share while software is expected to grow at the fastest CAGR during the forecast period.

Largest Revenue Share

Equipment

Market Share Leader

In the base year of 2024, equipment accounted for the largest market share. This is primarily because equipment, in physical or capital goods form, encapsulates a broad range of machines, devices, and instruments. Often, this equipment serves as the backbone of operations in many industries, thereby making it indispensable. Organizations, both big and small, continuously invest in equipment to carry out their day-to-day operations, for maintenance, and most importantly for upgrading purposes. It's a common practice across the globe, making the demand for equipment across different industries high, and thereby pushing its market share up. Moreover, most of the equipment has a long life span, certain regulation and supply conditions which make it expensive, contributing to its large revenue share. The switching cost from one equipment to another is generally high, making the current buyers stick to their purchase for a long time and hence, driving repeat purchases of the same equipment. Lastly, equipment purchases aren’t geographically limited, contributing to its reigning position in terms of revenue.

Fastest CAGR

Software

Forecast Period Growth Leader

Software subsegment is expected to grow at the fastest Compound Annual Growth Rate during the forecast period. There are a few key growth drivers for this. First, the continuous evolution and advancement in technology are leading to the creation of new software frequently, catering to the niche needs of many industry verticals. Second, digital transformation across different sectors is pushing businesses to adopt software systems in order to standardize and streamline their operations. However, adoption barriers include compatibility issues with the existing technology stack and high initial capex. Partnerships between software providers and businesses could be a catalyst for growth in this market. As companies recognize the advantages of software in improving efficiency and effectiveness in their processes, the demand for custom and innovative software solutions increases. Policy catalysts could include the introduction of regulations promoting or mandating the use of software to improve process integrity and accountability. Near-term risks might include issues related to privacy, data security, and regulatory compliance. It's noteworthy to highlight that these projections are based on typical market structures assuming an uninterrupted scenario of growth.

By Technology

The technology-oriented market is categorized into subsegments such as Fluorescence Recovery After Photobleaching (FRAP), Total Internal Reflection Fluorescence Microscopy (TIRF), High-Content Analysis, and Fluorescence In Situ Hybridization (FISH). In 2024, Fluorescence Recovery After Photobleaching (FRAP) generated the largest revenue and, interestingly, Fluorescence In Situ Hybridization (FISH) is predicted to grow with the fastest CAGR in the period forecasted.

Largest Revenue Share

Fluorescence Recovery After Photobleaching (FRAP)

Market Share Leader

Fluorescence Recovery After Photobleaching (FRAP) leads the technology-oriented market revenue in 2024. This technique's popularity has risen due to its ability to provide kinetic information on a microscopic scale in real-time. Numerous fields, including molecular biology, neuroscience, and cell biology, use FRAP to investigate the dynamics of cellular processes. Additionally, its utilization in drug discovery and development has amplified, enlarging its customer pool. Geographically, developed regions exhibiting high research & development activities contribute significantly to FRAP's adoption and, in turn, its revenue. Regulatory support championing innovative technologies also precipitates FRAP's dominance. Purchasing criteria such as solution effectiveness, repeatability, and real-time detail provision position FRAP favorably. While the channel for this segment is primarily direct due to its technical nature, collaborations with academic institutions and research facilities extend its reach.

Fastest CAGR

Fluorescence In Situ Hybridization (FISH)

Forecast Period Growth Leader

Fluorescence In Situ Hybridization (FISH) is projected to grow at the fastest CAGR in the forecast period. FISH is a crucial technique for detecting genetic abnormalities and understanding genetic diseases, offering a strong growth driver as genetic research intensifies globally. While adoption barriers exist due to high setup costs and technical complexity, these are being offset by growing partnerships between academia and commercial establishments driving technological advancements and reducing costs. Government policies fostering genetic research and encouraging proactive healthcare measures act as significant catalysts. Furthermore, with capital investments flowing into biotechnology, FISH's growth potential is magnified. The method's acceptance, however, could be affected by short-term risks such as changing government policies, regulatory issues, and economic instabilities in certain regions. Nonetheless, the outlook for FISH remains highly positive and promises potent growth opportunities.

By Application

The market is divided into subsegments including Drug Discovery, Cell Biology, and Others. Of these, Drug Discovery accounted for the largest revenue share, while Cell Biology is expected to grow at the fastest CAGR during the forecast period.

Largest Revenue Share

Drug Discovery

Market Share Leader

Drug Discovery stands as the reigning contributor to the largest revenue share in this segment. This is primarily driven by the increasing trend of medical advancements and the rising prevalence of various diseases that require novel therapeutic approaches. The necessity to develop new drugs is intensified by the growing global health concerns, boosting the revenues in Drug Discovery applications. Large-scale drug discovery projects are typically sponsored by big pharmaceutical companies, which contribute significantly to the revenue of this sector. The companies are also highly competitive and seek to find breakthrough treatments, pushing more resources into Drug Discovery. Additionally, government bodies worldwide are promoting drug discovery by providing funds and implementing supporting rules, fueling the segment's growth. Furthermore, the interconnectedness of the global pharmaceutical industry, coupled with the constant innovation that the sector demands, contributes to the robust revenue stream of this segment.

Fastest CAGR

Cell Biology

Forecast Period Growth Leader

Cell Biology represents the fastest growing subsegment, which can be attributed to its indirect implications on the progress of medical and pharmaceutical fields. The advancements in cell biology research provide valuable insights into the mechanisms of disease development and progression, thereby assisting in the designing of therapeutic strategies. Plus, rapid technological advancements in bio-imaging techniques and molecular biology have enabled in-depth study of cells, accelerating the growth of this subsegment. Furthermore, the increased focus on personalized medicine and genomics necessitates thorough knowledge of cell biology, thus catalyzing demand. However, the high cost of advanced microscopy and imaging techniques could hinder growth momentarily. Notwithstanding, collaborations between major players and research institutes for technology development and knowledge exchange are expected to outweigh the adoption barriers, driving substantial growth.

By End User

The market is divided into subsegments including Pharmaceutical Companies, Hospitals, and Biotechnology Companies. Of these, Pharmaceutical Companies accounted for the largest revenue share, while Biotechnology Companies are expected to grow at the fastest CAGR during the forecast period.

Largest Revenue Share

Pharmaceutical Companies

Market Share Leader

Pharmaceutical Companies form the largest revenue segment in the healthcare value chain. Their dominant position is primarily driven by their role in the drug discovery, development, and commercialization process. This process is rigorous, often costly, and regulated by stringent bodies across regions, creating high entry barriers for other industry players. Pharmaceutical firms invest significant capital to develop new treatments, generating substantial returns once these drugs hit the market and are adopted at scale. They also extend their market coverage through expansive distribution networks, enabling them to swiftly supply drugs across geographies. Further, robust relationships with healthcare providers and regular purchases from hospitals and clinics underline their revenue superiority. However, the segment also faces challenges; drug patents' expiry and generics' rise tests these companies' capacity to innovate and continuously generate new revenue sources.

Fastest CAGR

Biotechnology Companies

Forecast Period Growth Leader

Although relatively smaller in scale compared to Pharmaceutical Companies, Biotechnology Companies are projected to expand at the fastest pace. This growth outlook is underpinned by their innovative focus on advancing the latest technologies for healthcare applications, including genomics, bioinformatics, and microbiome science. Increasing collaboration with academic institutions and research centers has too accelerated their pace in product innovation. Similarly, policy support for bio-based research and development activities, coupled with rising venture capital investments, enhances their growth prospects. However, their potential for rapid growth is also pressured by regulatory scrutiny, long lead times, and uncertainties over securing adequate funding. Adapting to these challenges and aligning with technological disruption will allow these companies to maintain their growth trajectory while enriching the market with diverse healthcare solutions.

Competitive Analysis

Key Market Players

Manufacturers / OEMs

Carl Zeiss AG
Germany
Leica Microsystems
Germany
Nikon Corporation
Japan

Key Suppliers & Raw Materials

Thermo Fisher Scientific, Inc.
US
Sigma Aldrich
US
Agilent Technologies, Inc.
US

Distributors, Integrators & Channel Partners

PerkinElmer, Inc.
US
Olympus Corporation
Japan
BD Biosciences
US

Porter’s Five Forces Analysis

This is a Porter's Five Forces analysis for the live cell imaging market.

Supplier Bargaining Power

Medium

High technology dependence balances various suppliers' quality and pricing variations.

Buyer Bargaining Power

High

Pharmaceutical industry, a major buyer segment, holds significant power in price negotiations.

Threat of Substitutes

Low

Technological specialization reduces the threat of substitute products in the market.

Threat of New Entrants

Medium

High investment costs and expertise limit new entrants, but advancements may allow small competition.

Competitive Rivalry

High

Intense rivalry exists due to technology advancements and broad range of applications in healthcare.

Regional Analysis

Geographic market dynamics and growth opportunities across key regions

Global Market Outlook

live-cell-imaging-market market regional share

North America

In 2024, the North American live cell imaging market was characterized by significant advancements in microscopy technologies and a surge in the development of cell-based therapeutics. Driving factors prominently included high demand from research institutes for advanced microscopy systems, fueled by escalating needs for intricate cellular analysis. Investments in the biopharmaceutical sector have amplified, with companies seeking to enhance both R&D capabilities and production efficiency. Notably, government regulations supporting clinical research played a crucial role in market growth, prompting further technology adoption in locations such as the United States. Additionally, ongoing efforts in biotech firms to optimize supply processes have led to increased usage of live cell imaging.

Regarding trends, buyer behavior leaned heavily towards automated microscopy systems given their high-throughput screening abilities. Product advancements introduced phase contrast microscopes that allowed better observation of live cell morphology, indicative of a strong technology shift. Partnerships and mergers became commonplace as enterprises sought to capitalize on research expertise. In terms of policy enforcement, the FDA's reinforcement of stringent guidelines for cell-based products necessitated further live cell imaging in the healthcare sector. Overall, the sectors greatly influencing the 2024 live cell imaging market spanned healthcare, research institutions, and biopharmaceutical manufacturing. Demand from these sectors, regulatory policies, and technological progress significantly shaped the North American landscape.

Asia Pacific

In 2024, the Live Cell Imaging Market in Asia Pacific had experienced significant development driven by several key factors. Technological advancements in bioimaging techniques across research facilities in China and Japan stimulated market growth. Local governments' increased funding for life sciences research, especially in India and Australia, supported the market having a substantial technology adoption. Moreover, increased in-vitro drug testing within the pharmaceutical industry fueled demand for live cell imaging products, bolstered further by favorable pricing dynamics in key ASEAN markets. Buyer behavior trends reflect a growing preference for high-content screening products for enhanced analytical performance. The emergence of 4D imaging technology reshaped product offerings, presenting notable advancements in the market's technological landscape. South Korea led the way in significant channel dynamics, with supply chain streamlining to deliver cell imaging products more efficiently.

Furthermore, strategic partnerships were prominent, as demonstrated by Japanese and Chinese companies partnering to increase market penetration. Lastly, the enforcement of stricter regulations on drug development processes sustained the need for live cell imaging, particularly in the pharmaceutical sector. Market beneficiaries spanned several sectors including healthcare, research institutions, and the biotechnology industry. The enterprise segment showed robust demand due to the rising need for better diagnostic tools. Accordingly, the Live Cell Imaging market in 2024 was a dynamic blend of drivers and trends, with significant influences driving demand and technological evolution across the Asia Pacific region.

Europe

In 2024, there was significant growth in Europe's Live Cell Imaging market, propelled by numerous factors and evolving trends for their prime countries. Drivers of this momentum included mounting demand from pharmaceutical and biotechnology enterprises, governmental regulations endorsing adoption of advanced imaging technologies, and increased investments in healthcare R&D across key markets such as Germany, the UK, and France. Technological advancements such as high-content screening also bolstered the market, incentivizing more businesses to embrace this innovative approach. The supply dynamics, particularly in Italy and Spain, focused on promoting accessibility to advanced technologies at competitive pricing.

Various trends shaped the regional landscape. Stringent policy enforcement in Benelux and the Nordics kept the manufacturers adhering to high-quality standards. Advancements and wider acceptance of quantum dots technology were observed in Central & Eastern Europe, as it offers resolution at a molecular level and enables real-time viewing. In addition, partnerships and M&A activities were on the rise, with firms aiming to expand their foothold. The shift toward digital pathology underpinned the market's expansion, as retail healthcare facilities preferred this technology for its ability to render high resolution and 3D images. Meanwhile, increasingly prevalent teleconsultations in healthcare services directed medical practitioners towards live cell imaging.

Latin America

In 2024, the Live Cell Imaging market in Latin America (LATAM) gained substantial traction, reflecting a rising demand for real-time monitoring and sophisticated cell biology research. Overcapacity in Brazil and Mexico bolstered widespread adoption due to decreased pricing, while investment in cutting-edge technologies stirred market expansion in Argentina, creating a favorable supply dynamic environment. Regulatory support in Colombia, primarily driven by the government's commitment to enhance healthcare services, prompted improved technology adoption. However, supply constraints in Peru strained the market notwithstanding the high investment in health research. Shifting trends pointed toward an increased preference for high-content screening services by Argentina's pharmaceutical sectors, sparked by their pursuit for accelerated drug development. Meanwhile, a well-implemented policy in Chile supported the growth of partnerships and mergers, influencing standardization in the market. In Brazil, customer behaviors gravitated towards customized imaging solutions, mainly in the healthcare and enterprise sectors, while in Mexico, academia and research institutes showed a remarkable inclination towards high-resolution imaging systems.

Furthermore, demand from Colombia's retail sectors for innovative, yet affordable technologies surged, triggering competition among manufacturers. However, a lack of skilled professionals in Peru posed a challenge, underscoring the pressing need for effective training programs. Product shifts in the base year pointed to a rising demand for software-enhanced imaging systems across LATAM, pushing manufacturers to reevaluate their product offerings. Overall, the LATAM market in 2024 showed a mixed landscape of opportunities and challenges, driven by variables like technology adoption, pricing and buyer behavior.
Middle East & Africa

In the base year 2024, the Live Cell Imaging Market in the Middle East and Africa showcased considerable expansion, led by countries like Saudi Arabia, United Arab Emirates, Qatar, Egypt, South Africa, Nigeria, Kenya, and Israel. The growth was driven by an increase in chronic disease incidence, the advancement of healthcare infrastructure, and the growing adoption of high-throughput screening methods for drug development. Additionally, government support and increased investment in biomedical research significantly enabled market expansion. The market witnessed trends such as the rising demand for high-content screening in personalized medicine and the expansion of healthcare IT, which fuelled the use of live cell imaging in the region.

Partnership activities for technological advancements also emerged as a significant trend, as witnessed in the collaboration between Israeli biomedical firms and UAE health setups. Digitization, particularly in countries like Saudi Arabia and UAE, accelerated the use of AI and machine learning algorithms in imaging information extraction. This digital shift has seen a greater emphasis in sectors such as healthcare, research and development facilities, and pharmaceutical manufacturing. Stricter policy enforcement around health and medicine further stimulated market growth, as seen with changing healthcare regulations in South Africa and Egypt.

Recent Industry Developments

Latest market innovations, product launches, and strategic initiatives

July 2026

Curiosis, a Korean lab automation company, signed a five-year supply agreement with Merck KGaA to supply cell imaging automation products built on its Celloger Mini Plus live-cell imaging platform. Merck will distribute the products worldwide through EMD Millipore under its own brand.

January 2025

Ramona launched the Vireo™ live-cell imaging system at the SLAS2025 conference, featuring 24 miniaturized 4k video microscopes and real-time AI image processing capable of analyzing a 96-well plate across 5 channels in under 2 minutes — an order of magnitude faster than traditional solutions.

Frequently Asked Questions