Cell Counting Market Snapshot

Key Players

  • Thermo Fisher Scientific Inc. (US)
  • Bio-Rad Laboratories Inc. (US)
  • Agilent Technologies Inc. (US)
  • Merck KGaA (Germany)
  • Danaher Corporation (US)
  • Becton Dickinson and Company (US)
  • PerkinElmer Inc. (US)
  • Promega Corporation (US)
  • Tecan Group Ltd. (Switzerland)
  • Nexcelom Bioscience LLC. (US)

Market Size

Base Year 2024
$10.28 Bn
CAGR
8.86%
Forecast 2034
$24.03 Bn

Market Segments

By Product
  • Consumables
  • Instruments
By Application
  • Research Applications
  • Clinical & Diagnostic Applications
  • Others
By End User
  • Pharmaceutical & Biotechnology Companies
  • Hospitals
  • Research Institutes
  • Others

Market Dynamics

Drivers
  • Advancements in Cell Counting Technology
  • Increased Research in Cytology
Restraints
  • High equipment costs
  • Lack of skilled personnel
Opportunities
  • Advancements in Cell Counting Technologies
  • Increasing Biotechnology Research

Market Size

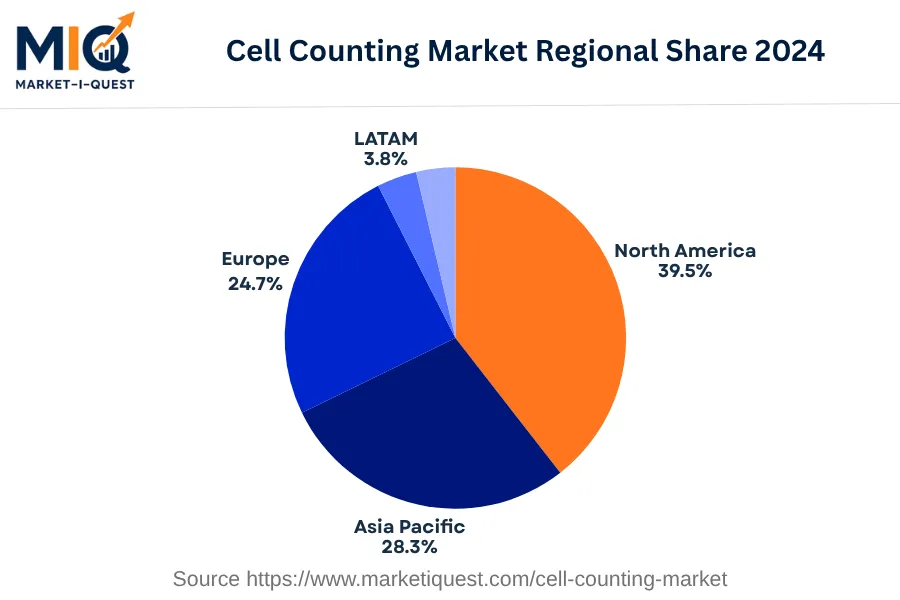
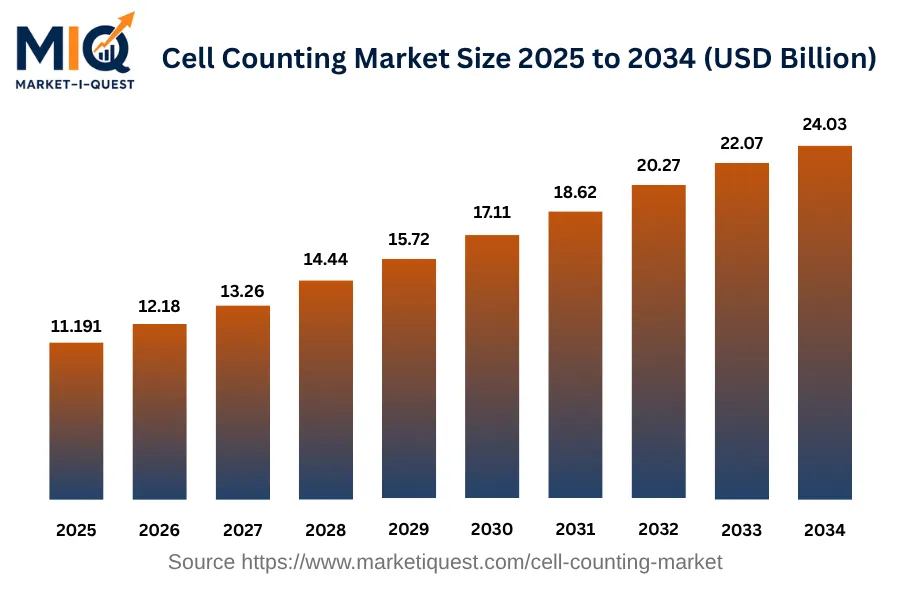
The Cell Counting Market size is projected to increase from USD 11.19 billion in 2025 to USD 24.03 billion by 2034. It is important to note that the growth rate during this period represents a Compound Annual Growth Rate (CAGR) of 8.9%. This substantial increase is largely due to the constant advances in related technologies and improved infrastructure for research and development in healthcare. Furthermore, there is a persistent demand for precision and reliability, which has driven robust evolution of cell counting mechanisms over the decade. Such factors contribute significantly to the overall expansion of the market over the period. In terms of regional share as of 2024, North America dominated the market with a share of 39.5%, followed by Asia Pacific at 28.3% and Europe at 24.7%. Meanwhile, regions such as LATAM and MEA held smaller shares at 3.8% and 3.7%, respectively. These percentages reveal a relative distribution of the market across various regions, hinting towards their individual contributions to the overall market size.

Key Takeaways

  • By Product - Consumables held a dominant presence in the cell counting market.
  • By Application - Clinical & Diagnostic Applications emerged as the leading segment in recent years.
  • By End User - Pharmaceutical & Biotechnology Companies accounted for a significant market share.
cell-counting-market market size

Key Driving Factors

Implementation of 3D Cell Cultures

In both academia and the biotechnology/pharmaceutical sector, cell counting methods play a pivotal role in adhering to experimental continuity and efficacy. Recently, researchers have chosen to shift from two-dimensional (2D) cell counting methods to three-dimensional (3D) cell cultures. They mimic living organism conditions better than their 2D counterparts which resonates with real-world effect. This transition to more realistic cell culture conditions means that cell counting market will be driven by this need for 3D cell counting tools and technologies. This trend is likely to continue, as more researchers adopt this method to increase the reliability and applicability of their findings.

Adoption of High-Throughput Screening

High-throughput screening (HTS) is a method used extensively in drug discovery and biology to identify active compounds, antibodies, or genes which modulate a particular biomolecular pathway. The process involves automated cell counting to deal with the large scale of samples, hence the more refined and efficient the cell counting method is, the more accurate results are obtained, leading to better drug development practices. As pharmaceutical companies and research institutions strive for more effective drug discovery processes, the reliance on HTS and, by extension, cell counting aids, is expected to intensify driving the cell counting market forward.

Market Evolution by Timeline

2019-2023
In the timeframe of 2019-2023, biotechnology companies and research institutions in North America and Europe were the primary buyers of cell counting products, driven by applications in drug discovery and cancer research. Instruments like flow cytometers and cell counters integrated with imaging software were launched to streamline the cell counting process. However, high cost of advanced counters and budget constraints of academic institutes posed a challenge. Regulatory aspects focused on the compliance of International Conference on Harmonization (ICH) and Good Laboratory Practice (GLP) standards. Commercially, suppliers often partnered with research institutes. The main risk focused on the accuracy of cell counting systems when detecting diverse cell types.
2024
In 2024, the Asian market, specifically China, and India showed significant demand due to their expanding healthcare sector and biomedical research development. Automated cell counter manufacturers offered products which ensured greater accuracy and speed, although challenged by high costs. Standards set by the Asian Scientific Community became critical in influencing market adoption. Typically, companies offered usage-based fee models, along with sales of devices. Risks included technology compatibility issues and training personnel given the increasing automation of cell counting systems.
2025-2029
Between 2025 and 2029, the application of cell counting in stem cell research and personalized medicine grew drastically. The emergence of more portable cell counters improved user convenience, but uniformity in results across different instruments remained a concern. Updated ISO guidelines directed the compliance requirement for vendors. Commercially, partnerships with technology companies for integrating AI-based technology in cell counters were common. Risks appeared in the form of replication of cell count results due to the issue of standardizing cell suspension preparation methods.
2030-2034
In the period 2030 to 2034, demand from Middle Eastern and African regions increased, driven by the growing importance of diagnostic applications in diseases like cancer and HIV. The market saw a rise in handheld devices with cloud-integrated capabilities for real-time analysis. Regulatory guidelines continued to evolve, particularly in developing countries with less stringent rules. License-based models gained popularity, and long-term contracts with service level agreements became typical. Risks included potential data privacy concerns with cloud integration and challenges in strict adherence to evolving regulatory guidelines.

Future Market Outlook

Future Opportunities

The cell counting market is poised for growth due to several emerging opportunities rooted in existing trends. The push for personalized medicine, especially following the global COVID-19 pandemic, has resulted in increased investment by biopharmaceutical companies in advanced cell analysis technologies. This aligns with the 2020 establishment of the National Cell Counting Consortium, which focuses on standardization of cell counting methods across laboratories in the United States. Another significant area of opportunity lies in the integration of cell counting technologies with digital health platforms, which has gained traction since 2021. Companies like Roche and Siemens are exploring collaborations to develop integrated digital tools that leverage cell counting data for comprehensive patient monitoring. Environmental factors, including global initiatives focused on sustainable healthcare practices, are driving demand for low-cost, efficient cell counting methods in developing countries. As laboratory automation becomes commonplace, suppliers of cell counting technologies are likely to forge partnerships with automation firms, mirroring trends observed in Europe. Moreover, the ongoing advancements in nanotechnology may open new avenues for enhanced detection capabilities, allowing researchers to explore subcellular analysis. Overall, the synergy between regulatory advancements and technological innovations represents a fertile ground for future developments in the global cell counting market.

Segmentation Analysis

By Product

The market is divided into subsegments including Consumables and Instruments. Consumables accounted for the largest revenue share while Instruments is expected to grow at the fastest CAGR during the forecast period.

Largest Revenue Share

Consumables

Market Share Leader

The Consumables subsegment is the leading revenue generator in the product segment. This can be attributed to the high usage rate of consumables in various industry applications. As the name suggests, these are products that see high turnover rates due to their nature of being consumed, replaced, and replenished on a regular basis. Some of these consumables include lab reagents, test strips, gloves, tubing, filters, and so on. The high frequency of purchase and the indispensability in respective industries contribute significantly to their revenue generation. Another driver for this growth is the increasing technological advancements and regulatory approvals that provide a constant stream of newer, improved products. The global spread of industries that rely on these consumable products also diversifies the market base. It's noteworthy that consumables have the advantage of being less impacted by economic downturns compared to high-cost instruments, since they are essential to continue operations.

Fastest CAGR

Instruments

Forecast Period Growth Leader

On the other hand, the Instruments subsegment is expected to record the fastest growth over the forecast period. The main drivers for this growth can be attributed to the rapid technological advancement in the sector, the need for precision and accuracy in results, and increasing automation. With businesses constantly seeking for ways to improve efficiency, the demand for advanced, automated instruments is surging. Instruments like analyzing equipment, laboratory balances, spectrometers, centrifuges, chromatographs among others, are all seeing significant developments and adoption. However, the high capital costs and the need for well-trained personnel to operate these advanced instruments could pose a barrier. It is likely these increased costs will be outweighed by the advantages these instruments bring in the near future. Strategic investments, partnerships aimed at technological development, as well as policy reforms promoting the use of sophisticated instruments could act as catalysts for this segment’s growth.

By Application

The market is divided into subsegments including Research Applications, Clinical & Diagnostic Applications, and Others. Clinical & Diagnostic Applications accounted for the largest revenue share while Research Applications is expected to grow at the fastest Compound Annual Growth Rate (CAGR) during the forecast period.

Largest Revenue Share

Clinical & Diagnostic Applications

Market Share Leader

Clinical & diagnostic applications emerged as the most lucrative subsegment due to their significance in disease diagnosis and healthcare services. The increasing prevalence of diseases, coupled with the ongoing technological advancements in diagnostic procedures, has been contributing to its largest revenue share. Regulatory bodies across the globe continue to implement favorable policies to encourage the adoption of advanced diagnostic methods which is further pushing the growth of this subsegment. In terms of customers, this subsegment caters to hospitals, diagnostic centers and clinics which present a broad customer base with a wide range of needs. Specific purchasing criteria that drive this subsegment include accuracy, speed, and the ability to diagnose a range of conditions. The wide application of these procedures in various health scenarios marks its dominating market position in terms of revenue.

Fastest CAGR

Research Applications

Forecast Period Growth Leader

Research applications subsegment is projected to portray the fastest CAGR outlook. This can be attributed to the growing investment in research and development activities, especially in life sciences and biotech industries. Technological leaps, like developments in AI and machine learning, are propelling this growth by enhancing research efficiency and potential. Increasing research collaborations and partnerships between academic institutions and companies create a conducive environment for growth. However, high capital expenditure could pose a barrier. Rising support from governments around the world and increasing demand for personalized medicine are likely to act as catalysts pushing the growth of this subsegment. Near-term risks include strict regulations and ethical concerns around certain types of research, which can potentially retard the speed of adoption.

By End User

The market is divided into subsegments including Pharmaceutical & Biotechnology Companies, Hospitals, Research Institutes, and Others, with Pharmaceutical & Biotechnology Companies accounting for the largest revenue share, while Research Institutes are expected to grow at the fastest CAGR during the forecast period.

Largest Revenue Share

Pharmaceutical & Biotechnology Companies

Market Share Leader

Pharmaceutical & Biotechnology Companies comprise the subsegment with the highest revenue. Several factors contribute to this. First, these companies are typically large organisations with significant operating budgets, providing a large customer base for the market. Furthermore, they are commonly engaged in a number of research & development activities that necessitate the use of products and services in this market. Another essential factor is the trend towards outsourcing. Many pharma and biotech companies are outsourcing their R&D activities to concentrate on their core competencies. This trend is expected to augment the market growth during the forecast period. Lastly, since these companies operate globally, they are subject to rigorous and varying regulatory requirements that keep them on the edge of technological capabilities and updates, thus driving constant demand.

Fastest CAGR

Research Institutes

Forecast Period Growth Leader

Research Institutes are predicted to be the fastest growing subsegment. The main drivers of this growth include increased government funding for research activities, a growing emphasis on innovative research projects to bring scientific advancements, and the rising demand for breakthrough treatments for various illnesses. Barriers hindering adoption include lack of infrastructure in certain geographical regions and stringent regulatory guidelines for research activities. Catalysts for growth include increased collaborations between research institutes and industry players, advancements in technologies supporting research, and positive changes in policies, including incentives for research activities. The near-term risks for this segment include economic uncertainties which could potentially lead to reduced funding for research, and the potential for regulatory changes that could impact how research is conducted.

Competitive Analysis

Key Market Players

Manufacturers / OEMs

Agilent Technologies
US
Danaher
US
Thermo Fisher Scientific
US

Key Suppliers & Raw Materials

Merck KGaA
Germany
GE Healthcare
US
Bio-Rad Laboratories
US

Distributors, Integrators & Channel Partners

VWR International
US
Avantor
US
MilliporeSigma
US

Porter’s Five Forces Analysis

This analysis studies the competitive forces influencing the cell counting market.

Supplier Bargaining Power

Medium

Reliance on specialized providers for equipment and reagents moderately impact suppliers' power.

Buyer Bargaining Power

High

Many options for cell counting methods and product suppliers give buyers significant power.

Threat of Substitutes

Low

The lack of substitute products and high switching costs minimize threat of substitutes.

Threat of New Entrants

Medium

Innovation in technology may lower entry barriers, but high R&D and regulatory compliance costs impede new entrants.

Competitive Rivalry

High

Existing competition is high with several well-established players in the market with competitive offerings.

Regional Analysis

Geographic market dynamics and growth opportunities across key regions

Global Market Outlook

cell-counting-market market regional share

North America

In the base year 2024, the North American cell counting market was characterized by significant advancements in biomedical research and healthcare services. Drivers included an increasing demand for cell counting in diagnostic research, propelled by growing incidences of chronic diseases in the U.S., Canada, and Mexico. Regulations regarding health and safety in laboratories further drove adoption, necessitating precise cell counting in research environments. Investments in technological advancements also proliferated, resulting in more efficient, affordable, and automated cell counting systems.

Behavioral shifts in buying patterns revealed a growing customer preference for technologically advanced and automated cell counting devices due to their high precision and reduced human error. Regular technological updates also led to substantial shifts towards automated systems from traditional manual counting methods, especially in the healthcare sector. There was an increase in partnerships and acquisitions amongst major market competitors, often aimed at broadening product portfolios and gaining a competitive edge. A notable trend was the strict enforcement of policy standards for cell counting to ensure safety, accuracy, and reliability in diverse sectors such as healthcare, pharmaceuticals, and biotechnology. For instance, the U.S. Food and Drug Administration (FDA) implemented stringent regulations on cell counting device manufacturers to maintain high safety and quality standards.

Asia Pacific

The Asia Pacific cell counting market in 2024 experienced significant growth, driven by factors such as an increase in the prevalence of diseases, improved healthcare infrastructure, and technological advancements. In terms of demand, India and China saw a surge due to a rise in cancer and infectious disease incidences, pressuring diagnostic labs to adopt advanced cell counting technologies. Government regulations in Japan, aiming to ensure accurate biomedical research, made labs invest in precision instruments, boosting the market.

Concurrently, a shift in trends was observed. In Australia and South Korea, buyers preferred automated cell counters for their convenience and accuracy over manual methods. Technology-wise, a shift towards fluorescence-based counting techniques was noted in key ASEAN markets due to their enhanced sensitivity and selectivity. Channel-wise, online sales gained preference due to their availability and competitive prices. Also, partnerships and M&A activity were observed as companies sought to reinforce market share and gain technical expertise; a notable case was the strategic collaboration of India-based Agappe Diagnostics with Hitachi High-Tech Corporation.

On a sectorial level, healthcare providers, such as hospitals and diagnostic labs, represented a significant customer base due to the vital role of cell counting in clinical decision-making and research. Manufacturing industries were partial to cell counters for quality control and regulatory compliance. With a well-established demand and evolving methodologies, the Asia Pacific cell counting market made great strides in 2024.
Europe

In the base year 2024, the cell counting market in Europe has seen significant development and is gaining traction in scientific research and healthcare settings across the region. Key drivers include the increased demand for diagnostics and research in cellular therapy, along with surges in public and private investments in biologics, personalized medicines, and stem cell research. Technologically advanced cell counting products are increasingly adopted, boosted by government incentives promoting innovation in biomedical fields. Pricing dynamics that encourage competitive affordability have also bolstered the market.

Several trends have emerged in 2024, including a strong shift toward automated cell counting systems due to their accuracy and time efficiency. This is reflected in the purchasing behaviours of enterprises and healthcare organizations. A strategic inclination toward partnerships and M&A activities has been observed, aiming to diversify product offerings and gain a competitive edge. Increased regulation witnessed in 2024 helps enforce industry standards, ensuring product quality and safety across countries like the UK, Germany, France, and Spain. In sectors like biopharmaceuticals and academia, a growing emphasis on glycomics and proteomics research in the Nordics, Benelux, and Central & Eastern Europe is also noted, further fuelling the cell counting market.

Latin America

In 2024, the cell counting market in Latin America (LATAM) experienced a surge in activity due to various factors across dominant countries including Brazil, Mexico, Argentina, Colombia, Chile, and Peru. Drivers for this included the bolstered demand for genomic and proteomic research, resultant of the elevated incidence rates of chronic diseases in the region. Lax regulatory norms further propelled the uptake of high-throughput screening methods in drug discovery approaches. Additionally, investment in biotechnology mushroomed, facilitating increased adoption of advanced cell counting techniques across countries, particularly Mexico and Brazil.

Simultaneously, trends in the sector were distinctly shaped by changes in buyer behavior and technological progression. In particular, healthcare institutions showed increasing preference for automated cell counters to enhance the precision and speed of operations, epitomized by Colombia's adoption of novel cytometry devices. The emergence of cloud-based platforms for data storage and analysis fostered new age collaborations in the sector, leading to an uptick in partnerships across LATAM. Policy enforcement also played a crucial part, with Argentina implementing robust guidelines for regenerative medicine applications, underscoring the importance of reliable cell counting in the sector. From healthcare to pharmaceutical R&D sectors, these evolving circumstances significantly shaped the dynamics of the LATAM cell counting market in the year 2024.

Middle East & Africa

In 2024, the Cell Counting Market in the Middle East and Africa exhibits dynamic growth driven by various factors. Population health initiatives in Saudi Arabia and the UAE have created strong demand for advanced diagnostic tools, such as cell counting, pushing up market volume. Nigerian and Kenyan governments' investment in healthcare infrastructure have also played a pivotal role, particularly in the improved supply and accessibility of advanced cell counting technologies. Moreover, Egypt's adoption of digital pathology facilitated by government regulations propels market growth.

Trends reflect significant shifts in consumer behavior and policy enforcement. Israeli labs increasingly favor automated over manual cell counting methods due to improved efficiency and accuracy. Likewise, in South Africa, a strong drive towards digitalization in healthcare leads to increased adoption of automated cell counting systems. Additionally, partnerships, like the one between Qatari government and international biotech firms, promote technological knowledge transfer in cell counting techniques. Policy enforcements in the oil and gas sector in the UAE necessitate regular health checks for employees, indirectly influencing cell counting market dynamics. In this diverse market landscape, the government, healthcare, oil and gas, and telecom sectors emerge as key customer segments, shaping the demand and supply trends in the cell counting market in the Middle East and Africa.

Recent Industry Developments

Latest market innovations, product launches, and strategic initiatives

January 2026

ChemoMetec entered into a Letter of Intent with Roche Diagnostics to explore combining their technologies into validated solutions in bioprocess monitoring, starting with developing connectivity between ChemoMetec's XM30 cell counter and Roche's Cedex Bio Analyzer.

September 2025

Precision Cell Systems (PCS) officially launched following the strategic acquisitions of S2 Genomics and ORFLO, creating a unified company that addresses critical bottlenecks in cell analysis workflows. ORFLO is known for its instruments that combine cell counting and viability assessment with flow cytometry capabilities.

Frequently Asked Questions