Carbon Nanomaterials Market Snapshot

Key Players

  • Nanocyl SA (Belgium)
  • Cheap Tubes Inc. (United States)
  • Arkema SA (France)
  • Kumho Petrochemical Company (South Korea)
  • Thomas Swan & Co. Ltd. (United Kingdom)
  • NanoIntegris Technologies Inc. (United States)
  • Showa Denko K.K (Japan)
  • Toray Industries Inc. (Japan)
  • Nanoshel LLC (United States)
  • Nanotech Energy Inc. (United States)

Market Size

Base Year 2024
$5.96 Bn
CAGR
10.76%
Forecast 2034
$16.56 Bn

Market Segments

By Type
Carbon Nanotubes, Carbon Nanofibers, Carbon Black, Activated Carbon, Graphene
By Form
Powder, Dispersion, Film, Composite
By Purity
>95%, >98%, >99%, >99.9%
By Application
Electronics, Energy Storage, Industrial, Biomedical, Aerospace and Defense, Others

Market Dynamics

Drivers
  • Increasing industrial applications
  • Advanced technological developments
Restraints
  • High production cost
  • Technological complexities
Opportunities
  • Emerging energy storage applications
  • Increasing nanotechnology research investments

Market Size

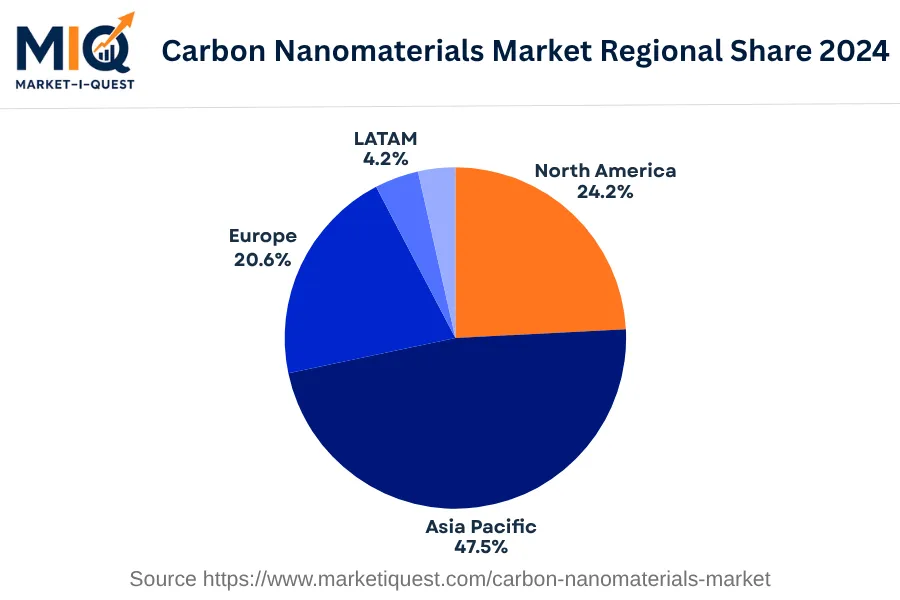
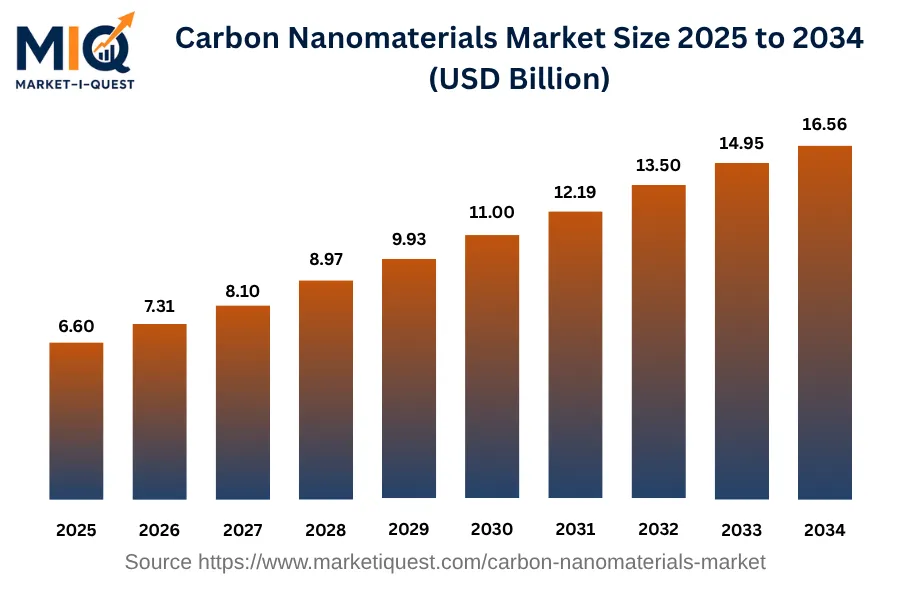
The Carbon Nanomaterials Market size in 2025 is projected to be $6.60 billion, a rise from the $5.96 billion in 2024. By the year 2034, the market size is expected to have almost tripled to $16.56 billion, growing at a compound annual growth rate (CAGR) of 10.76%. This rapid increase in the Carbon Nanomaterials Market size over the decade can be attributed to continuous innovations and advancements in carbon-based nanotechnology, leading to its increasing applications. The higher adaptability and functionality of carbon nanomaterials resulted in its soaring demand in various sectors. According to regional data of 2024, Asia Pacific held the largest share in the Carbon Nanomaterials Market at 47.5%, followed by North America at 24.2%, and Europe with a 20.6% share. The remainder was split between LATAM possessing 4.2% and MEA holding a minimal 3.5% of the market share.

Key Takeaways

  • By Type - Activated Carbon held a significant position boasting the largest market share in 2024.
  • By Form - Powder took the lead accounting for the highest market share in 2024.
  • By Purity - Materials with >98% purity expanded the quickest reporting the most growth throughout 2024.
  • By Application - Electronics emerged as the top segment holding the largest share of the market in 2024.
carbon-nanomaterials-market market size

Key Driving Factors

Strict environmental regulations on hazardous emissions

Industrialized nations are tightening regulations and standards aimed at controlling hazardous emissions from various industries. For instance, the European Union's Environmental Standards set stringent limits on the release of pollutants. This tough regulatory landscape is turning industries to seek for cleaner materials. Carbon nanomaterials are emerging as an appealing choice because they provide comparable performance to traditional materials while emitting less harmful substances. As such, they are increasingly replacing heavy metal components in industries such as automotive and aerospace, driving the growth of the carbon nanomaterials market.

Adoption of lightweight materials in automotive industry

The modern automotive industry is on a continuous quest to make vehicles lighter without compromising safety. Manufacturers believe that lightweight cars can enhance fuel efficiency, lower carbon emissions and meet regulatory targets. Carbon nanomaterials hold great promise in this context as they possess high strength-to-weight ratio, providing a significant weight reduction when used in car components. A key example is the incorporation of carbon nanotubes in car body parts, where they provide strength and lightness. These factors are compelling automotive manufacturers to increasingly incorporate carbon nanomaterials in their designs, pushing up demand in the market.

Market Evolution by Timeline

2019-2023
Between 2019–2023, demand for Carbon Nanomaterials was primarily driven by industries such as automotive, electricals, and pharmaceuticals especially in North America and Europe. Supply was primarily from manufacturers in East Asia, and technical challenges caused inconsistencies in output quality. Legal regulations such as REACH in EU and TSCA in USA, influenced the conformity of environmental standards and savvy supply. Contractual agreements focused on raw material procurement and product delivery with slight variations in pricing depending on the grade of the material. Challenges involved the difficulty in mass production and high production cost.
2024
In 2024, demand for Carbon Nanomaterials shifted towards the renewable energy sector, including the advancement of solar panels and enhanced battery technologies. Supply was focused from manufacturers in China, where integration of nanotech manufacturing matured. Regulatory environment continued with the adoption and enhancement of standardized regulations like RoHS in Europe, pushing for reliable toxic substance control. Vaccine development shined a light on pharmaceutical application, leading to its increase in demand. Commercially, dynamic pricing models got adopted due to fluctuations in raw material costs. The risk of inconsistency in supply remained due to dependence on few major manufacturers.
2025-2029
From 2025–2029, a significant rise in demand was observed from the electronics and aerospace sectors, attributed partially to advancements in nanotechnology applications. The supply chain matured, with increased production capacities in North America and Europe, easing previous constraints. Policies were increasingly focused on safe nanomaterial handling and disposal, such as improvements to the Nano Risk Framework in the US. More long-term partnerships were formed in supply contracts, promoting sustainability efforts. While production was scaled, maintaining a high quality of carbon nanomaterials became the primary challenge.
2030-2034
In the period 2030–2034, a steady rise in demand was seen from the energy storage and advanced materials sector globally. Key suppliers were increasingly based out of India and Africa leveraging cost-effective manufacturing techniques. Stringent regulations were enforced around Nano Handling Standards, especially in developed countries. Transition to digital channels for sales and marketing was observed. Production expanded and quality stabilized with newer technologies. The persisting risk was environmental and health concerns related to the handling and disposal of carbon nanomaterials. Protective measures and risk mitigating strategies were adopted.

Future Market Outlook

Future Opportunities

The future landscape of the carbon nanomaterials market is characterized by emerging applications driven by ongoing research and regulatory developments. For instance, in 2022, the U.S. National Nanotechnology Initiative announced a strategic program focusing on nanotechnology applications in energy storage and conversion, indicating a government-backed push towards innovative energy solutions. The automotive industry is also adapting to incorporate carbon nanomaterials; in 2023, Ford and Carbon Clean partnered to explore the integration of nanomaterials into lightweight vehicle components, potentially reducing overall vehicle weight for improved efficiency. Furthermore, the electronics sector is seeing a trend toward greater adoption of carbon nanotubes for flexible electronics, with Samsung revealing prototypes utilizing these materials in 2021. Regulatory frameworks such as the EU’s REACH program are adapting to account for the unique properties of carbon nanomaterials, which can influence future manufacturing processes and compliance strategies. As governments worldwide implement stricter environmental regulations, opportunities arise for companies specializing in eco-friendly carbon nanomaterial products, as highlighted by the European Green Deal announced in 2019. This regulatory focus enhances demand for sustainable materials across various industries. The intersection of technology trends and policy initiatives presents vast opportunities for innovation and market expansion in the carbon nanomaterials sector as stakeholders navigate this evolving landscape.

Segmentation Analysis

By Type

The market is divided into subsegments including Carbon Nanotubes, Carbon Nanofibers, Carbon Black, Activated Carbon, and Graphene. Activated Carbon accounted for the largest revenue share while Graphene is expected to grow at the fastest CAGR during the forecast period.

Largest Revenue Share

Activated Carbon

Market Share Leader

Activated Carbon takes the lead in terms of income in base year 2024 driven by its diverse application in various industries such as water purification, air purification, metal extraction, medicine, and agriculture to name a few. The high surface area and microporous structure of Activated Carbon allow it to be an efficient adsorbent for removing impurities. It also plays a critical role in the energy sector where it used in batteries, supercapacitors, and energy storage. Its usage in industrial applications is driven by environmental regulations mandating industries to minimize pollution discharge. The primary customers are municipalities, manufacturers, utility providers, and healthcare agencies where it is used for decontamination or filtering processes. Also, due to the lack of effective alternatives at similar price points, the switching costs for these customers are high, ensuring a steady demand for Activated Carbon. The sales channels are majorly commercial distributors and manufacturers selling directly to these end users.

Fastest CAGR

Graphene

Forecast Period Growth Leader

Graphene is anticipated to record the fastest growth on account of its exceptional properties and broad future prospects. A single carbon atom thick, it is the thinnest material known to humans yet it's 200 times stronger than steel and an excellent conductor of heat and electricity. Its thinness, strength, and conductivity make it highly desirable in electronics, aerospace, automotive, and energy sectors. However, producing graphene is expensive and complex and large-scale production has been a barrier to the adoption of this nanomaterial. Thankfully, multiple partnerships and collaboration between companies and research facilities are taking place to lower production costs and improve yield, which will serve as a key growth catalyst in this subsegment. However, any lapses or delays in these partnerships or technological breakthroughs could pose near-term growth risks. Still, the subsegment's potential for significant technological and industrial impact puts it on a higher trajectory growth path.

By Form

The market is divided into subsegments including powder, dispersion, film, and composite. Of these, powder held the largest revenue share in 2024, while the film segment is projected to witness the fastest growth in the succeeding years.

Largest Revenue Share

Powder

Market Share Leader

Within the form segments, the 'powder' subsegment has been identified as the top revenue contributor as of 2024. The reason for its dominance can be traced back to its versatility and broad range of applications. Given its ease of use, powder forms are widely favored in various sectors, including construction, agriculture, and pharmaceuticals. It's common usage in products such as paints, ceramics, and drugs play a pivotal role in driving the substantial demand for it. Additionally, powder forms are comparatively easy to distribute and handle, making them an appealing choice for end-users. In terms of geography, Asia-Pacific, with its favourable industrial growth and robust supply chains, consumes a significant portion of the powder form. Customer preferences, difficulty in shifting to other forms due to high switching costs, and existing channels also count as factors that steer the high demand for the powder form.

Fastest CAGR

Film

Forecast Period Growth Leader

Projected to be the fastest-growing form is the film subsegment. While not currently the largest in terms of revenue, the segment's growth trajectory is influenced by several factors. Advancements in technology have been a key driver making the film form increasingly attractive for high-end, precision applications in electronics and renewable energy sectors. A growing trend towards miniaturization has spurred demand for films, as these can be produced to extremely thin dimensions. Also, new investments, focused on upgrading production capabilities and capacities, show signals of the accelerating adoption rate of the film form. However, there may be near-term barriers such as initial capital expenditure and a need for technical knowledge that could hinder immediate growth. But with strong supports from regulatory policies promoting cleaner, more efficient production methods, these barriers can turn into growth catalysts in the long run.

By Purity

The market, divided into subsegments by purity such as >95%, >98%, >99%, and >99.9%, displays varying dominance patterns, with the >98% purity subsegment accounting for the largest revenue share while the >99.9% purity subcategory is expected to grow at the fastest CAGR during the forecast period.

Largest Revenue Share

>98%

Market Share Leader

The >98% purity phase dominates the market revenue as of 2024 due to several industry-specific factors. This high purity segment caters to a majority of the applications which require a balance between cost-effectiveness and quality. Products of such purity usually exhibit adequate performance for most common-use cases, becoming the choice material for many manufacturers and suppliers. Furthermore, this segment has also been the recipient of considerable market demand deriving from regions with strict regulations on product quality and robust manufacturing sectors including North America and Western Europe. These areas see a high uptake for >98% purity due to the above-par performance it promises within a feasible cost range. Consumers tend to lean towards products with high, but not the highest components, reducing their individual costs while maintaining a degree of quality assurance. This combination of affordability and adequate quality makes the >98% purity segment the one holding the largest revenue share.

Fastest CAGR

>99.9%

Forecast Period Growth Leader

On the other hand, the >99.9% purity subsegment is projected to have the fastest CAGR in the imminent years. This is predominantly driven by an ever-rising demand for high purity products in advanced end-use industries such as biomedical, semiconductors, and scientific research. Though such grade materials are priced higher, firms engaging in cutting-edge technology development are willing to pay a premium for the remarkable quality and performance assured by this level of purity. In addition, continuous innovation and improved technology are likely to help overcome adoption barriers related to high costs, and are set to further fuel the market growth in this category. However, the risk remains in sourcing raw materials and maintaining consistency in the production of such high-purity products. Therefore, overcoming these challenges would be critical for realizing the estimated CAGR in the >99.9% purity subsegment.

By Application

The market is divided into subsegments including Electronics, Energy Storage, Industrial, Biomedical, Aerospace and Defense, Others. The Electronics subsegment accounted for the largest revenue share, while the Biomedical subsegment is expected to grow at the fastest CAGR during the forecast period.

Largest Revenue Share

Electronics

Market Share Leader

The prominence of the Electronics subsegment in terms of revenue share in the base year 2024 can be attributed to several factors. Primarily, the rapid technological advancements and the increase in consumer demand for high-technology electronic devices is driving growth in this segment. These include smart devices, integrated technologies, and automated systems that make extensive use of high-quality components. Further, the need for continuous power supply and energy efficiency in electronic products have pushed for advancements in this sector. The improved living standards and spending capacity of consumers drastically contribute to the growth of the Electronics subsegment. Additionally, the development of global infrastructure, expansion of industries, and increased automation of industrial processes have collectively spurred an increase in the demand for sophisticated electronic systems and devices, which contributes greatly to the largest revenue share of this subsegment.

Fastest CAGR

Biomedical

Forecast Period Growth Leader

The Biomedical subsegment is expected to have the fastest compound annual growth rate (CAGR) over the forecast period. This growth can be attributed to the strong research and development sector in biomedical technology, as well as the significant boost in healthcare investments globally. The increasing adoption of advanced technologies in biomedical engineering, particularly for diagnostic and therapeutic applications, is a significant driver of growth. Demand for surgical robots, wearable devices, and biomedical implants is on the rise. Alongside, broader health consciousness and an aging population stimulate increased demand for improved healthcare services, directly benefiting the Biomedical sector. However, significant barriers to adoption include intricate regulations and standards concerning biomedical devices, and funding constraints of healthcare providers in some regions. Thus, strategic alliances or partnerships among manufacturers may play a substantial role in overcoming these challenges and driving segment growth.

Competitive Analysis

Key Market Players

Manufacturers / OEMs

Nanocyl SA
Belgium
Arkema
France
Showa Denko Materials Co., Ltd
Japan

Key Suppliers & Raw Materials

Thomas Swan & Co. Ltd.
UK
Cheap Tubes Inc.
US
Nanoshel LLC
US

Distributors, Integrators & Channel Partners

MStor Inc.
US
MKNano
Canada
Nanotechnology Systems Corporation
Japan

Porter’s Five Forces Analysis

An examination of competitive pressures affecting the Carbon Nanomaterials Market.

Supplier Bargaining Power

High

Limited suppliers and high production costs increase supplier bargaining power.

Buyer Bargaining Power

Medium

Buyers possess noteworthy bargaining power due to the rapid evolution and advancement of nanotechnology products.

Threat of Substitutes

Low

Unique properties and performance advantages make substitutes scarce in the Carbon Nanomaterials market.

Threat of New Entrants

Low

High capital costs and technical expertise barriers deter new entrants in the market.

Competitive Rivalry

High

Intense competitive rivalry due to significant research efforts and ongoing technological advancements.

Regional Analysis

Geographic market dynamics and growth opportunities across key regions

Global Market Outlook

carbon-nanomaterials-market market regional share

North America

In 2024, North America's carbon nanomaterials market sustained robust growth, primed by demand and technological advances. Market drivers included escalating demand from sectors like healthcare, utilities, and manufacturing industries. Healthcare initiatives, for example, placed significant emphasis on biomedical applications of carbon nanotubes, bolstering adoption rates. In contrast, advancements in energy storage catalyzed by nanomaterials cemented utilities’ interest. The manufacturing sector saw carbon nanomaterials as vital in enhancing product durability. Further, regulations favoring sustainable and energy-efficient solutions increased carbon nanomaterials' attractiveness. Federal and provincial governments in Canada encouraged their utilization to bolster the manufacturing sector’s energy efficiency. A similar scenario held true in the U.S. and Mexico, where government policies underpinned the carbon nanomaterial-infused product market.

Trends involved shifts towards cleaner manufacturing processes and novel biomedical applications. The growing need for less energy-intensive procedures saw a surge in adopting carbon nanotube-infused composites. Partnerships and M&A activity were common among market players, underpinning scale, accessibility, and technology development. Regulatory enforcement ensured adherence to sustainable manufacturing standards, shaping manufacturers' operations, and product offerings. Prominent customer segments included the public sector, which procured solutions for infrastructure and energy projects. The private sector, predominately manufacturing and healthcare, sought nanomaterials to bolster product strength and efficiency or pave the way for cutting-edge medical solutions. The retail sector bore witness to their entry in products offering enhanced durability.

Asia Pacific

In 2024, the Carbon Nanomaterials Market in the Asia Pacific experienced significant growth. Strong demand from manufacturing, electronics, and energy sectors, particularly in China, India, and Japan, served as a pivotal driver. The region's dedication to advancing technology adoption, including nanotechnology, amplified market activity. Regulatory policies favoring nanotechnology implementation, exemplified in China's “863 Program,” propelled market expansion, alongside substantial regional investment in nanomaterials production and research. Notably, the market experienced upward pressure on prices due to supply constraints in key raw materials.

Significant trends were evident in buyer behavior, with increased demand for high-performing and lightweight materials in sectors such as aerospace and automotive. Technology shifts towards reducing energy consumption and emissions also shaped the market, evident in South Korea and Japan's strong reliance on advanced materials for energy storage and conversion. Rapid digitalization propelled the electronics sector, requiring advanced carbon nanomaterials for increased device performance, particularly in China and ASEAN markets. An uptrend in strategic partnerships and M&A further facilitated technology transfer and product development, such as LG Chem's partnership with the Chinese Academy of Sciences for advanced materials research. Lastly, commitment to stringent policy enforcement, as evidenced by Australia's National Measurement Institute's precise regulation of nanomaterial standards, solidified the market's structure and performance.

Europe

In 2024, the Carbon Nanomaterials Market in Europe remains a pivotal sector with elements of growth and significant transformation. Market Drivers: A robust demand for advanced electronics and materials in sectors including automotive, manufacturing, and healthcare fuels a surge in carbon nanomaterials. Market regulation promotes sustainability, leading to an increased investment in green engineering projects, particularly in Germany, the UK, France, and the Nordics. Spain and Italy noted significant technology adoption in the energy sector supplementing applications of carbon nanomaterials. The price of elemental carbon shows a stabilising trend, ramping up the competitive supply dynamics.

Market Trends: Buyer behavior indicates a preference for value-added products, pushing manufacturers towards innovation in product design and technology. Notably, a shift towards eco-friendly tech in the manufacturing and utilities sectors has taken flight in the Benelux region. There's observable growth in strategic partnerships and M&A activities to garner market share, particularly within the Central & Eastern European region, propelling standardization across the industry. The European Union’s enforcement of stricter safety and environmental regulations in 2024 is guiding the market in a sustainable and safer direction. In conclusion, heightened demand, technology adoption, and market regulation are driving Europe's Carbon Nanomaterials Market in 2024, while shifts in buyer behavior and policy enforcement reflect key market trends.

Latin America

In 2024, the Carbon Nanomaterials Market in Latin America was fragmentally defined, with largely unconnected activity across the region’s heterogeneous economies. Significant drivers included increasing demand for advanced materials in industries such as electronics and automotive, particularly in Brazil and Mexico where manufacturing sectors were robust. Moreover, investment in nanotechnology research, especially in Argentina, fostered market growth. The drive towards renewable energy solutions in Chile and Peru also stimulated the market, as carbon nanomaterials were critical to enhancing solar panel efficiency.

Noteworthy trends in this market were the growing adoption of carbon nanotubes in the healthcare sector due to their potential for targeted drug delivery and diagnostic applications. Regulatory pressure for environmental protection endorsed the demand for carbon nanostructure-based filtration systems in utilities, supported by government policies such as Mexico's National Strategy on Transition to a Green Economy. Additionally, partnerships and M&A activities surged as key players sought to consolidate their positions. In terms of channels, direct sales dominated over other forms of distribution, demonstrating the importance of strong manufacturer-customer relationships in the LATAM region. Lastly, advancements in production technology reduced material costs, further propelling market development.

Middle East & Africa

In 2024, the Carbon Nanomaterials Market in the Middle East and Africa exhibited dynamic growth due to several key drivers and prevailing trends. Market expansion was fueled by demand increases from sectors such as oil and gas, manufacturing, and healthcare. The healthcare sector in particular, embraced nanomaterials for drug delivery and diagnostic advancements. Regulations further propelled the market, with countries like Israel endorsing policies promoting advanced material use. Investment was another key driver, with economies such as Saudi Arabia and the UAE ramping up funding for technology adoption, encapsulating increased capacity for nanomaterial production. Moreover, Nigeria and South Africa leveraged their rich carbon resources for nanomaterial supply, affecting the market's pricing dynamics favorably.

Trends observed in 2024 included a shift towards green synthesis methods, prompted by heightened environmental concerns. Conscious buyer behavior led to an increased demand for sustainably produced nanomaterials. Partnerships solidified, too — government entities, especially in Egypt and Qatar, collaborated with private firms to address application-specific R&D. Technology shifts marked the use of carbon nanotubes in utility sectors, improving energy storage in regions such as Kenya. Simultaneously, a policy enforcement brought tighter regulations, ensuring product standardizations across countries, contributing significantly to the Carbon Nanomaterials Market evolution in the Middle East and Africa in 2024.

Recent Industry Developments

Latest market innovations, product launches, and strategic initiatives

January 2026

Rice University researchers successfully validated an industry-first structural recycling technique for carbon nanomaterials. The methodology proves high-performance carbon nanotube fibers can be fully reclaimed without losing molecular architecture or tensile strength, setting a new circular framework for composite manufacturing.

August 2025

Nanotherm and Battelle formed a structural joint venture called Novara™. The newly launched commercial entity leverages advanced carbon nanomaterial technologies to develop and market high-efficiency thermal management solutions for the automotive and industrial sectors.

August 2025

Teknos Group Oy and UP Catalyst signed a joint partnership to integrate sustainable carbon nanomaterials into industrial coatings. The collaboration replaces fossil-based carbon black with eco-friendly green carbon nanotubes synthesized directly from captured carbon dioxide.

Frequently Asked Questions