Captive Power Generation Market Snapshot

Key Players

  • Wärtsilä Corporation (Finland)
  • Caterpillar Inc. (US)
  • Cummins Inc. (US)
  • Aggreko Plc (United Kingdom)
  • General Electric Company (US)
  • MAN SE (Germany)
  • Siemens AG (Germany)
  • Rolls-Royce Power Systems AG (Germany)
  • Shanghai Electric Group Co. Ltd. (China)

Market Size

Base Year 2024
$65.43 Bn
CAGR
5.82%
Forecast 2034
$115.20 Bn

Market Segments

By Technology
Heat Exchangers, Turbines, Gas Engines, Transformers, Others
By Fuel
Diesel, Gas, Coal, Others
By Connectivity
Off-Grid, On-Grid
By End Use
Industrial, Commercial, Residential

Market Dynamics

Drivers
  • Rising energy demand
  • Government incentives/subsidies
Restraints
  • High installation costs
  • Regulatory compliance challenges
Opportunities
  • Rising industrialization rate
  • Increased power generation demands

Market Size

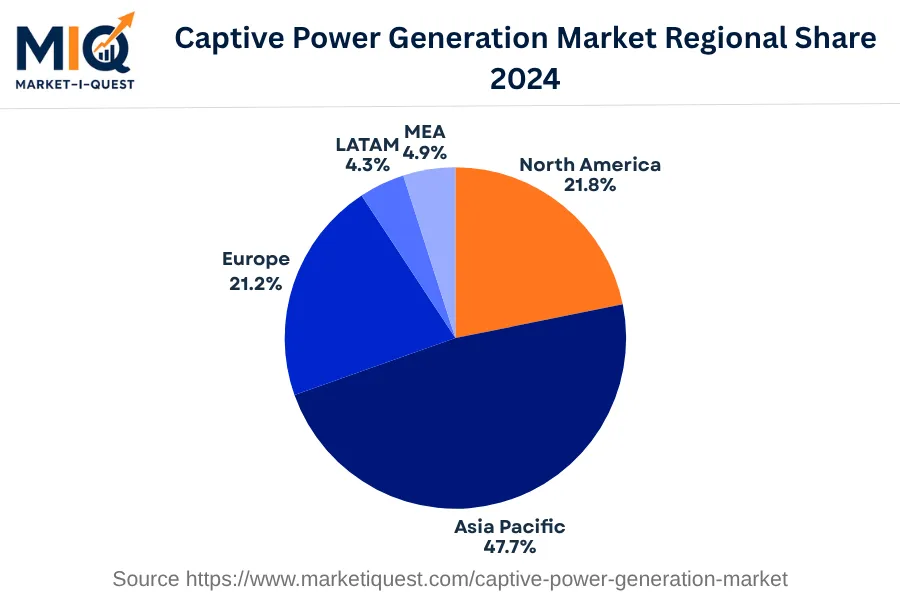
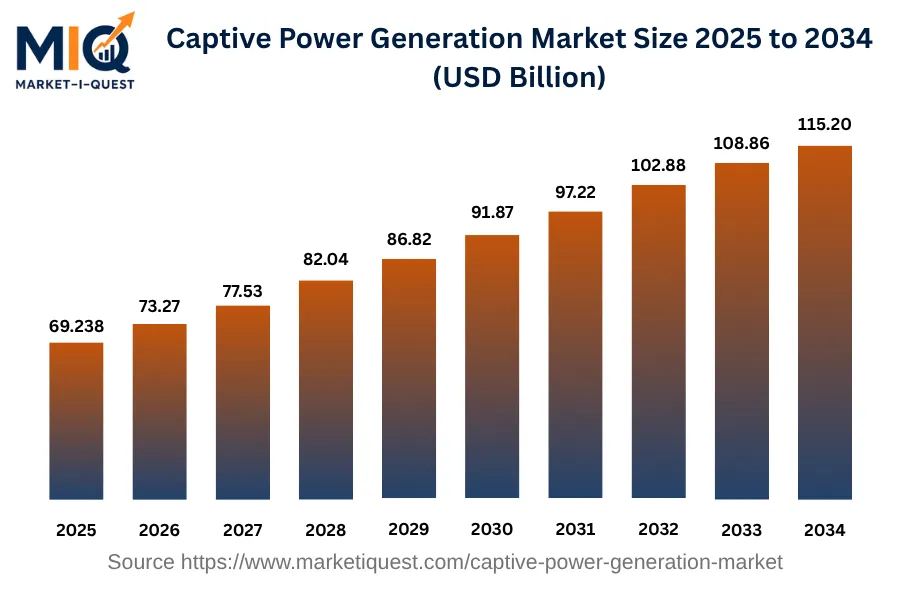
The Captive Power Generation Market was poised at 65.43 billion USD in 2024 and experienced growth reaching 69.24 billion USD in 2025. This market continued its upward trajectory from 2025 until 2034, where it achieved a valuation of 115.20 billion USD. This growth trajectory was characterized by a compound annual growth rate of 5.8% over the duration of this period. Acceleration in the Captive Power Generation Market was shaped by the consistency in energy consumption and the pressing need for reliable power sources that encourage entities to invest in captive power generation. The regional division of this market in 2024 displayed North America with a share of 21.8%, closely followed by Europe at 21.16%. However, the Asia Pacific region held a dominating stake in the market, accounting for 47.7% of the overall share. The shares of LATAM and MEA regions were found to trail behind with a contribution of 4.3% and 4.9% respectively.

Key Takeaways

  • By Technology - Turbines led with significant market share.
  • By Fuel - Diesel led underlining its key role in the industry during this year.
  • By Connectivity - On-Grid segment held a significant share in the market in 2025.
  • By End Use - Industrial category led the captivation in 2025.
captive-power-generation-market market size

Key Driving Factors

Escalating Industrial Electricity Demand

The Captive Power Generation Market is greatly driven by the escalating demand for electricity in industrial sectors, prominently the cement and steel industries. Difficulties in obtaining reliable power supply from grid-based sources have directed various large-scale industries towards sourcing energy from captive power generation units. This is particularly observed in developing countries, where issues with grid stability, power outages and electricity theft translate to increased business operating costs. By utilizing captive power generation, businesses can ensure an uninterrupted, reliable supply of electricity in their operations, improving overall productivity while significantly reducing downtime costs.

Government Regulations and Policies Promoting Renewable Energy

Strict government regulations and policies across the globe are prompting businesses to adopt renewable energy solutions. Captive power generation facilities, particularly those utilizing renewable sources such as wind and solar, have been given immense support through policies including feed-in tariffs, capital subsidies and tax rebates. This measure is aimed at reducing greenhouse gas emissions and promoting cleaner energy sources. The cost of generating electricity via fossil fuels is also increasing, due to environmental regulations and carbon taxes. Therefore, businesses are exploring renewable captive power generation options as a sustainable, economically viable alternative. As a result, the market for captive power generation units, especially those that use renewable energy resources, is experiencing significant expansion.

Market Evolution by Timeline

2019-2023
During this period, many industries, including manufacturing and processing plants such as metal, cement, and paper, increased their reliance on captive power generation to secure reliable and cost-effective power supply. This shift came as a response to frequent power outages in developing countries like India, China, and Nigeria. In terms of technology, combined heat and power systems were ahead in terms of both piloting and integration maturity, largely due to their energy efficiency. However, the supply faced a significant constraint: lack of infrastructure for accessing and transporting alternate fuels, like biomass and bio-gas. This period saw the introduction of regulations favoring low-carbon energy sources, like the Clean Energy Standard Act in the U.S. Generally, the price trended towards a slight increase due to rising equipment costs, but longer-term contracts allowed some price stability. Key risks during this window were delayed infrastructure development and growing biomass procurement costs.
2024
Bucking the previous trend, 2024 witnessed a slowdown in captive power generation due to falling grid electricity prices, notably in developed countries, given compatibility with existing infrastructure. The solar technology, backed by significant technology advancements, saw a notable pilot phase in industries seeking cleaner power alternatives. These alternatives got a boost when the American Clean Energy Innovation Act aimed to modernize the country's power infrastructure. Prices for captive power generation components stayed stable, partly due to accumulated manufacturing efficiencies. Despite these, there were practical blockers, chiefly regulatory: many regions lacked clear rules for integrating captive power projects into national grids, complicating efforts to handle surplus output.
2025-2029
During this period, demand for captive power generation diversified to include data centers and real estate developers, particularly in dense urban regions where grid reliability was increasingly uncertain. There was a consolidation towards two technologies, namely solar and natural gas. Regulators, now well-versed with this industry, began adopting policies to streamline interconnection and account for surplus power. The Australian Distributed Energy Resources Register is a prime example. The commercial model saw an increase in turnkey contracts where service providers cover design, manufacturing, and installation. Risk factors included uncertain fuel prices, flaring up primarily due to geopolitical tensions in oil-rich regions.
2030-2034
In this period, there was an unexpected surge in demand from rural and off-grid communities, specially in Africa and South Asia, for renewable-based captive power generation. Declining costs of wind turbines led to wind energy gaining ground against solar and natural gas. Notably, the international ISO 50001 Energy Management standard played a significant role in encouraging best practices for energy use and efficiency. The pricing mechanism saw a shift towards performance-based contracts, tying the cost to the successful achievement of specific energy output and efficiency targets. However, the supply remained constrained by the shortage of skilled manpower to operate and maintain advanced power generation technologies.

Future Market Outlook

Future Opportunities

The captive power generation market offers multiple future opportunities, primarily influenced by regulatory frameworks and technological advancements. Currently, India's Electricity (Amendment) Bill of 2023 aims to facilitate decentralized power generation, promoting increased adoption of captive power systems across industries, particularly in manufacturing and heavy industries. This regulatory shift from centralized to decentralized models fosters energy independence, allowing firms to bypass volatile electricity markets. Concurrently, the Global Climate Change Agreement calls for countries to commit to reducing greenhouse gas emissions, further motivating companies to explore cleaner energy options. In North America, the expansion of carbon credit trading systems under the Paris Agreement encourages industries to invest in sustainable captive generation technologies to comply with emission reduction targets. Additionally, the rising costs of grid electricity create strong incentives for businesses to invest in on-premise renewable energy systems, resulting in potential partnerships between technology firms and traditional utilities. The development of battery storage technologies, alongside expanding electric vehicle (EV) infrastructures, also opens new avenues within this market. Collaborative efforts between energy providers and automotive companies could lead to synergies in utilizing captured energy more efficiently. Therefore, as regulations evolve and technological innovations continue, the captive power generation market presents a landscape rich with opportunities designed to address both energy needs and sustainability goals.

Segmentation Analysis

By Technology

The technology market is categorized into various subsegments including heat exchangers, turbines, gas engines, transformers, and others, among which turbines account for the highest revenue share, while gas engines are anticipated to grow at the fastest CAGR during the forecast period.

Largest Revenue Share

Turbines

Market Share Leader

Turbines, mostly used in power generation and aviation industries, have recorded to have the highest share in revenue in this market segment. Broadly, demand is driven by the increasing infrastructure development and urbanization in developing economies, rapid industrialization, and growing demand for energy efficiency in developed economies. Expanding aviation and power generation sectors across geographies like Asia-Pacific and Middle-Eastern countries also contribute significantly to the revenue generation of turbines. The competitive advantage of turbines over other technologies in terms of efficiency and productivity further strengthens their market positioning. Regulatory standards promoting the reduction of carbon emissions also push the growth of efficient turbine technologies. High switching costs due to the complexity of integrating and operating other technologies also keeps the customers faithful to turbines, hence supporting its revenue lead in the market.

Fastest CAGR

Gas Engines

Forecast Period Growth Leader

Gas engines market, though not the most revenue-generating, is the fastest-growing subsegment in the technology market. The key growth drivers for this subsegment include their wide range of application in energy production and the rise in demands for co-generation (combined heat and power) systems. They play a pivotal role in reducing carbon footprint, which suits the growing trend towards eco-friendly solutions in line with rigorous environmental regulations governing carbon and noise emissions. Technological advancements and efficiency improvements make gas engines a viable option for energy supply. The outlook is bolstered by favorable government policies in developing countries promoting investments in gas-fired power plants and grid stability programs. Despite the robust outlook, the high initial costs and implementation challenges might serve as barriers to its adoption, albeit in the short term.

By Fuel

The market is divided into subsegments including Diesel, Gas, Coal, and Others. In 2024, the Diesel subsegment accounted for the largest revenue share, while the Others category is expected to grow at the fastest CAGR during the forecast period.

Largest Revenue Share

Diesel

Market Share Leader

As of the base year 2024, the Diesel subsegment had the largest market share in terms of revenue. Diesel fuel is extensively used across various industries, including transportation, construction, and power generation, driving its market size. In the transportation sector, diesel engines are favored due to their higher efficiency and better mileage compared to gasoline engines. Additionally, diesel generators are widely utilized for backup power supply in commercial and industrial sectors, which contributes significantly to its high revenue. Emerging economies with growing infrastructural development, such as India and China, has further intensified the demand for diesel, hence expanding its market share. Despite stricter environmental regulations advocating for cleaner fuel alternatives, the current dependence on diesel, particularly in developing countries, continues to uphold its prominent position in the market.

Fastest CAGR

Others

Forecast Period Growth Leader

Despite the current market dominance by traditional fuels like diesel, gas, and coal, the 'Others' subsegment shows the fastest growth in terms of CAGR. This category includes alternative fuels such as biofuels, ethanol, and hydrogen, which are gaining traction given the global shift towards cleaner and renewable energy sources. Though still nascent, these alternative fuels are supported by progressive environmental policies and government incentives. Innovative technology development and strategic partnerships between fuel companies and tech firms are also potential catalysts, accelerating the shift towards these cleaner fuel options. Notwithstanding their promising growth, potential adoption barriers include higher costs of production and infrastructural challenges associated with distribution and storage. However, ongoing research and development initiatives, coupled with increasing environmental consciousness among consumers, can mitigate these risks and bolster the growth of this segment.

By Connectivity

The market is divided into subsegments including Off-Grid and On-Grid connectivity. In 2024, On-Grid connectors accounted for the largest revenue share while Off-Grid connectivity is projected to experience the fastest growth in the period ahead.

Largest Revenue Share

On-Grid

Market Share Leader

On-Grid connectivity locked the largest share of revenue in 2024 by virtue of its extensive application especially in developed economies where grid infrastructure is robust. The increasing need for constant and reliable power supply has propelled the demand for on-grid systems. Furthermore, regulatory bodies across different regions provide incentives, which encourage the adoption of on-grid systems, effectively driving their revenue growth. Reduction in equipment costs due to economies of scale has also made on-grid systems financially attractive for customers. Engagement with on-grid systems implies lesser switching costs, thanks to the existing infrastructure. Moreover, broad-scale public utility companies are predominant distribution channels for on-grid systems, allowing for a more expansive coverage and customer reach.

Fastest CAGR

Off-Grid

Forecast Period Growth Leader

Off-Grid solutions though trailing behind On-Grid in terms of revenue, are poised to grow at a faster rate moving forward. This surge can be attributed to several factors. With increasing advancements in technology, efficient and affordable off-grid systems have become a viable option, especially for remote areas with limited or no access to the main power grid. The drive towards decentralized power systems is playing a vital role in off-grid adoption, coupled with increasing capital investment into renewable off-grid technologies. Government push for rural electrification in developing regions through policy interventions also acts as a catalyst for off-grid growth. These systems, however, face adoption barriers due to higher initial costs and lack of consumer awareness, representing a near-term risk to this expected growth trajectory.

By End Use

The market is divided into subsegments including Industrial, Commercial, and Residential. The Industrial subsegment accounted for the largest revenue share while the Residential subsegment is expected to grow at the fastest CAGR during the forecast period.

Largest Revenue Share

Industrial

Market Share Leader

In 2024, the Industrial subsegment was found to generate the highest revenue. This could be attributed to various driving factors. Firstly, high capital intensive nature of industries creates a consistent demand for reliable products and services. Secondly, stringent regulatory scenario enforcing industrial sectors to adopt technologically advanced systems boosts the overall demand. In terms of geography, developed regions contribute significant shares to the revenue due to high industrialization. Industrial purchasing criteria play a crucial role too, typically prioritizing long-term value over upfront cost. As for the supply and channels, Industrial clients usually have direct and long-term contracts with manufacturers or accredited distributors, which adds a level of stability to the revenue figures. However, one should note the substantial switching costs if clients decide to change their product or service providers, which often serves as a deterrent from frequent shifts. These factors work together to keep the industrial subsegment ahead in generating the most revenue.

Fastest CAGR

Residential

Forecast Period Growth Leader

The Residential segment is forecasted to witness the fastest growth. One key aspect to this accelerated growth is the adoption rate. Residential consumers have started acknowledging the importance of environmentally friendly and energy-efficient products, which serves as a major growth driver. Also, government policies encouraging the installation of green appliances by providing subsidies and incentives have been significant catalysts. Partnership schemes with residential real estate players have boosted the adoption as well. However, affordability and knowledge about the usage and benefits remain barriers to adoption. As technological advancements increase and affordability improves, we expect the barriers to decrease. Near-term risks involve economic slowdown and policy change. A downturn can affect disposable income, which in turn might affect the growth. Nonetheless, the sector promises potential for market players willing to tap into its growth trajectory.

Competitive Analysis

Key Market Players

Manufacturers / OEMs

Siemens
Germany
GE
US
Caterpillar
US

Key Suppliers & Raw Materials

Bosch Rexroth
Germany
Komatsu
Japan
Hitachi Construction Machinery
Japan

Distributors, Integrators & Channel Partners

Alliance Power Company
US
Eaton Corporation
US
ABB
Switzerland

Porter’s Five Forces Analysis

The Captive Power Generation market is under a fair bit of competitive pressure, with diverse customer needs and significant supplier influence.

Supplier Bargaining Power

High

Suppliers anchored by fuel and equipment producers have high pricing power due to the specialist, global nature of their products.

Buyer Bargaining Power

Medium

Buyers, mostly industrial plants, have moderate power due to the essentiality of power supply and availability of alternatives.

Threat of Substitutes

Low

Substitutes like grid electricity often lack the dependability and scale required by industrial customers.

Threat of New Entrants

Low

Significant capital investment, regulatory hurdles, and technology barriers limit new entrants.

Competitive Rivalry

High

Existing players are fiercely competitive, driven by technological advancements, energy efficiency, and service quality.

Regional Analysis

Geographic market dynamics and growth opportunities across key regions

Global Market Outlook

captive-power-generation-market market regional share

North America

In 2024, the North American Captive Power Generation Market witnessed significant growth due to diverse factors. Drivers included stringent government regulations focused on reducing carbon footprint, particularly in the U.S. and Canada, propelling industries towards captive power generation. The rise in investment in renewable energy resources, especially by tech giants such as Google and Apple, further spurred growth. Additionally, technological advances facilitated the widespread adoption of decentralized power generation in regions with unstable power supply, notably Mexico.

On the trends side, there was a clear shift in buyer behavior favoring energy independence, with corporations keen on generating their own power to ensure uninterrupted operations. The adoption of renewable energy-based captive power systems witnessed a surge. There was an increase in partnerships and M&A among key players, particularly in the utilities and manufacturing sectors, to leverage shared technology and resources. Stricter policy enforcement by governments, e.g., the Clean Air Act in the U.S., also influenced the captive power market dynamics. Key sectors contributing to market growth included manufacturing industries, large-scale retail chains, and data centers needing high power reliability. government institutions also adopted captive power generation as a means to secure power supply for critical operations.

Asia Pacific

In 2024, the Captive Power Generation Market in Asia Pacific was shaped by significant industrial and regulatory stimuli. Policy initiatives, such as China's Clean Energy Program and India's Captive Power Plants policy, fueled the increase of sustainable and efficient power sources, stimulating capital investment in this sector. Rapid industrialization, particularly in manufacturing and retail sectors across key ASEAN markets, further augmented the demand for reliable power generation, prompting businesses to adopt captive power generation. Advancements in technology coupled with reducing costs of equipment catered to these demands, endorsing its increasing supply dynamics.

Concerning market trends, a noticeable shift towards renewable sources, particularly solar and wind energy, was apparent in Australia and Japan, driven by heightened environmental consciousness and supportive government policies. Buyer behavior exhibited a move towards customized, flexible energy solutions, with decentralization becoming a key characteristic of the Captive Power Generation Market. Within channel dynamics, partnerships and mergers played a strategic role; Hanergy’s collaboration with China’s FGS, for instance, significantly influenced the market landscape. Stricter policy enforcement, such as South Korea's Renewable Energy Standards, ensured adherence to environmental guidelines, persuading industries to explore cleaner power generation options. Hence, the Captive Power Generation Market manifested considerable integration, driven by regulatory frameworks, demand-supply factors, and technological advances.

Europe

In the base year of 2024, Europe’s Captive Power Generation Market was significantly defined by varying energy demands, regulations, and emerging technologies. Investments in energy-efficient technologies were driven by regulatory norms aimed at lowering emission levels, such as the EU's Clean Energy for all Europeans package. High-volume energy consumers like manufacturing units and utilities opted for captive power plants as a cost-effective, reliable, and flexible source of energy supply.The adoption of digital technologies within captive power systems, particularly in countries such as Germany and the United Kingdom, showcased growing interest in enhancing operational efficiency. In Spain and Italy, ongoing transitions toward renewable energy sources triggered modifications in captive power strategies.

On the trends front, we noticed a stronger inclination towards self-sufficiency in energy supply among large-scale enterprises. Undoubtedly, this led to heightened interest in investments in onsite power plants, specifically in the Nordics and Benelux regions. Additionally, partnerships and M&As increased among captive power companies and tech providers in Central and Eastern Europe, driven by efforts to incorporate advanced analytics and software solutions. In terms of policy enforcement, stricter regulations concerning carbon footprint reductions stepped up pressure on sectors such as healthcare, retail, and others to adopt captive power generation. Hence, this shaped significant transformations in the European Captive Power Generation Market scenario in 2024.

Latin America

In 2024, Latin America's Captive Power Generation Market was shaped by various economic, regulatory, and technological factors. Drivers of the market included favorable government policies such as Mexico's Energy Reform, substantial investments in renewable energy in Brazil, and Argentina's RenovAr program, which encouraged adoption of captives. Rapid urbanization and industrialization, particularly in Chile and Peru, necessitated the development of stable and efficient power generation systems, leading to an increase in the demand for captive power plants. Technological advancements, such as the adoption of smart grids in Colombia and digitization of utilities in Brazil, also significantly influenced the market's growth. However, high installation costs and lack of technical expertise were challenges that restrained market growth.

Trends observed in 2024 included a shift towards renewable energy sources, especially in Mexico and Colombia. There was also increased interest in mini-grid and off-grid power generation solutions from sectors such as manufacturing and government institutions in Brazil and Chile. In terms of market dynamics, partnerships, and M&As, Latin American utilities and multinational companies engaged in numerous strategic collaborations to enhance service delivery, build efficiencies, and improve reliability of captive power plants. Lastly, there was stricter enforcement of energy efficiency standards and policies across LATAM, aimed at reducing carbon emissions and promoting sustainable development.

Middle East & Africa

In 2024, the Captive Power Generation Market in the Middle East and Africa experienced a surge due to industrial growth and energy demand. Increased energy requirements from sectors such as manufacturing, telecom, and oil and gas, paired with power grid instability, fuelled the adoption of captive power plants. Governments in the region, notably Saudi Arabia and UAE, bolstered regulatory frameworks to facilitate domestic energy production, attracting significant investment in captive power solutions.

The trend towards renewable energy sources significantly influenced the market. Demand for solar-powered captive power plants increased substantially, particularly in nations such as Egypt and South Africa with abundant sunshine. Novel partnerships, such as Nigeria's Dangote Industries collaboration with Siemens AG for electricity generation, stood as testament to technology integration for heightened efficiency. Inconsistent electricity supply led to Israeli telecom companies shifting to captive power sources for uninterrupted operation. Kenya saw an increasing trend towards mini-grid systems in remote areas underserved by the main grid.

Stricter policy enforcement impacted the market heavily. For instance, a mandate by Saudi Arabia's government for nationalization of power generation (Saudisation) caused a major shift towards captive power in the country. Overall, the Captive Power Generation Market in 2024 saw a considerable spike in response to regulatory changes, technological advancements and evolving demand dynamics.

Recent Industry Developments

Latest market innovations, product launches, and strategic initiatives

September 2025

India's Ministry of Power issued draft amendments to captive power rules, clarifying ownership and consumption norms for cooperatives, associations, and SPVs, with stakeholder feedback.

Frequently Asked Questions