
Surface Vision & Inspection Market Snapshot

Key Players

  • Cognex Corporation (United States)
  • Microscan Systems (United States)
  • Omron Corporation (Japan)
  • Perceptron Inc. (United States)
  • AMETEK Surface Vision (United States)
  • Datalogic SpA (Italy)
  • Baumer Holding AG (Switzerland)
  • ISRA VISION AG (Germany)
  • KEYENCE Corporation (Japan)
  • Matrox Electronic Systems Ltd (Canada)

Market Size

Base Year 2024
$4.37 Bn
CAGR
7.85%
Forecast 2034
$9.30 Bn

Market Segments

By Component
Hardware, Software
By Surface Type
2D, 3D
By System
Computer-Based Systems, Camera-Based Systems
By End-Use Industry
Automotive, Electronics, Medical, Packaging, Aerospace, Others

Market Dynamics

Drivers
  • Technological advancements
  • Increasing automation demand
Restraints
  • High equipment costs
  • Limited technical expertise
Opportunities
  • Advanced Manufacturing Techniques Adoption
  • Miniaturization of Electronics Trend

Market Size

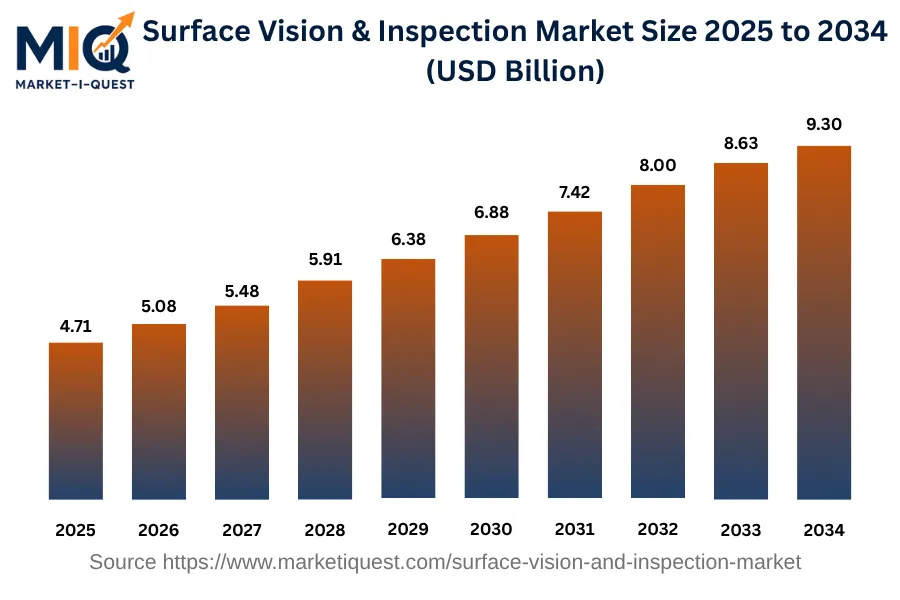
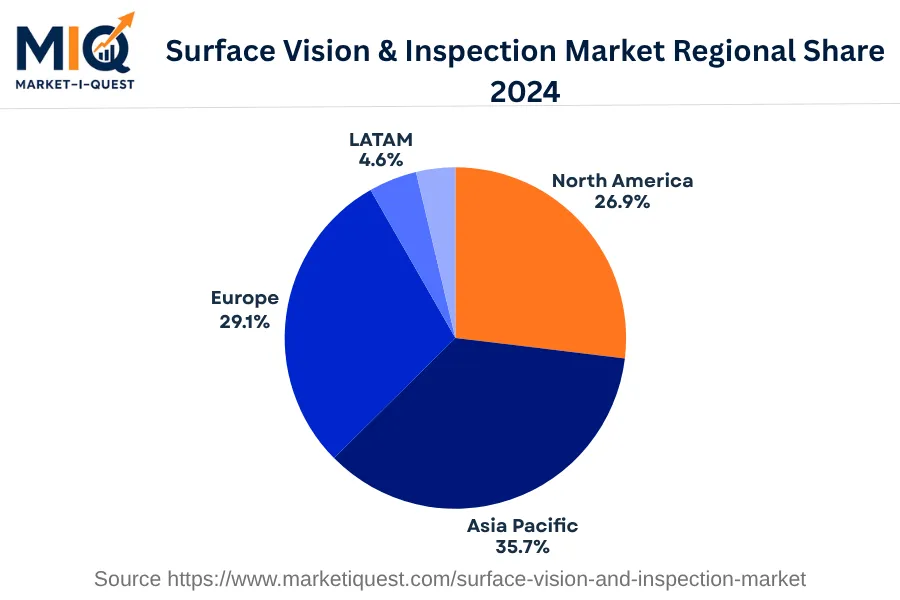
The Surface Vision & Inspection Market valued $4.37 billion in 2024 with a projection to reach $4.71 billion by 2025 and $9.30 billion by 2034 with a CAGR of 7.85%. The forecasted period indicates a consistent rise in value, demonstrating an increasingly preferred market by both investors and industry professionals. Globally, the regional distribution of the market in 2024. The largest share belonged to Asia Pacific at 35.68%, followed by Europe with 29.13% and North America at 26.91%. Less represented regions included Latin America, Middle East and Africa, holding 4.57% and 3.71% of the market share respectively.

Key Takeaways

  • By Component - Hardware subsegment led the Surface Vision & Inspection market holding a significant market share in the base year.
  • By Surface Type - 3D systems held a dominant position in the Surface Vision & Inspection market during the base year.
  • By System - Computer-Based Systems led accounting for a significant market share in the Surface Vision & Inspection market.
  • By End-Use - Automotive subsegment accounted for a notable share in the Surface Vision & Inspection market during the base year.
surface-vision-and-inspection-market market size

Key Driving Factors

Strict Quality Control Regulations in Manufacturing

Primary driving factors for the growth of market includes strict quality control regulations in global manufacturing industry. With multiple industries like automotive, electronics, pharma, food & beverages require stringent inspection of product quality to meet international standards and regulations. Surface vision and inspection systems offer high-precision in error detection and surface defect analysis, leading to reduction in manual inspections and increased quality control efficiency. With the increasing preference in industries aiming to increase rates with maintaining quality. The expanding application in quality-critical sectors is driving demand for surface vision and inspection technology driving the market.
Integration of AI and ML into Industrial Inspection Processes

Another significant driver is the integration of artificial intelligence and machine learning in industrial inspection processes. AI and ML, due to their ability of predictive analysis allowing surface vision and inspection systems to analyze through identified defects and adapt for future inspections. With allowing for improved accuracy and reducing human involvement. AI and ML integration also indicates faster processing speeds, more extensive inspections and capability to detect complex defects that are likely to be missed due to traditional inspection techniques. Manufacturers recognize this added value and are increasingly adopting AI and ML-integrated surface vision and inspection systems accelerating growth of the market.

Market Evolution by Timeline

2019-2023
Between 2019 and 2023, quality assurance initiatives necessitated demand for surface vision and inspection systems. Key buyers were primarily in Asia specifically China, due to its huge manufacturing sector. Technologically, 3D machine vision systems increasingly started featuring in these solutions, leading to increased integration abilities. In terms of policies China's Made in 2025 initiative acted as a significant adoption driver. Commercially, equipments were commonly leased on multi-year contracts with maintenance commonly included as part of contract.
2024
In 2024, notably automobile and semiconductor industries acted as a primary buyers of surface vision and inspection systems with Asia being the primary region. Advanced machine learning algorithms were integrated into systems subsequently enhancing them. European Union's General Data Protection Regulation (GDPR) influenced methods adopted for data storage and handling in this market. Companies typically used a subscription-model pricing for their software components, while maintaining independent pricing for hardware.
2025-2029
During 2025 to 2029, the pharmaceutical industry is excepted to dominate buyer segment required equipment for stringent quality control. North America is expected to increase adoption due to rising pharmaceutical industry in this region. The surface vision and inspection systems will be evolving with integration of deep learning capabilities. Standards, like ISO 9001, defined specific quality requirements driving more adoption. Growth of cloud-based solutions resulted in companies shifting their commercial model to Software as a Service (SaaS).
2030-2034
From 2030 to 2034, a set of industries, including food and beverage is estimated to begin necessitating the usage of surface vision. This will subsequently drove the demand in regions like South America, where these industries are growing. Developments in artificial intelligence and its integration into systems will be a significant trend, with allowing devices to autonomously perform defect detection. Encryption requirements under regulations like GDPR continued to evolve, implicating data management practices within market. Commercially, vendors started preferring extensive solutions packages includes both software/licensing and hardware. Companies will be well aware against rising cyber threats, resulting in a steep increase in investments towards cybersecurity.

Future Market Outlook

Future Opportunities

Evolving landscape surface vision and inspection creates various future opportunities, particularly in terms of increasing regulatory demands and technological integration. Ongoing initiatives like European Union’s focus on Green Deal highlights sustainability, driving manufacturers for implementing more stringent inspection protocols to ensure compliance with environmental standards. Additionally, integration of Industry 4.0 principles is expected to drive adoption of interconnected inspection systems across global supply chains. In China, with the increasing encouragement by government in smart manufacturing initiatives, which involve integrating advanced inspection technologies in production lines. Companies engaging in partnerships, like collaboration between ABB and Nvidia in July 2023, focus on creating solutions that supports AI for improved predictive maintenance, indicating a shift towards more intelligent inspection systems that reduce downtime. Furthermore, advancements in imaging technologies, such as developments by Teledyne Technologies in August 2023, include enhanced multispectral and hyperspectral imaging capabilities, highlighting opportunities for industries like food, safety and textiles. With these increasing trends, particularly in regions focusing on precision manufacturing like Germany and Japan demand for real-time data analytics and improved traceability in production processes will enable a way for advanced inspection solutions. Intersection of regulatory compliance and technology adoption is projected to expand surface vision and inspection market significantly in forecasted period.

Segmentation Analysis

By Component

The market is divided into subsegments including Hardware and Software. Among these, Hardware accounted for the largest revenue share while Software is expected to grow at the fastest CAGR during the forecast period.

Largest Revenue Share

Hardware

Market Share Leader

The Hardware subsegment held the largest share of revenue due to various factors. Majorly, the tangible nature of hardware makes it necessary for continuous digital operations and technological advancements leading to periodic upgrades of physical components drive substantial demand. Due to high demand, manufacturers often increase prices of hardware components, further rising contribution to the overall revenue. Hardware is widespread within broader client base including individuals, small and large businesses, government institutions, and others. The global requirement of hardware for its digital operations, ensuring steady revenue generation. Regulations generally favor sale of hardware devices, provided they meet specific quality and safety standards. Thus, purchases are often based on factors like performance, product life and technical support.

Fastest CAGR

Software

Forecast Period Growth Leader

The Software subsegment is projected to experience highest growth rate. The primary growth driver is the accelerating digital transformation worldwide, necessitating software applications for various functions in businesses and homes. Although initial adoption may face some resistance due to costs and training needs, the long-term cost efficiency of software, combined with its scalability capabilities, makes it an attractive investment. Technological advancements provide significant growth catalysts, introducing new features that trigger upgrades and new purchases. Furthermore, increase in partnerships among major players to integrate complementary solutions provides additional opportunities for software growth. Policy initiatives, especially those encouraging digitization, are also expected to spur market growth. However, growth may face near-term risks like data security concerns and initial implementation challenges. Overall, the software subsegment is undoubtedly the one to watch in the coming period.

By Surface Type

The market is divided into subsegments including 2D and 3D surface types. The 3D segment accounted for the largest revenue share in 2024, while the 2D segment is expected to grow at the fastest CAGR during the forecast period.

Largest Revenue Share

3D

Market Share Leader

The 3D surface type leads the market in terms of revenue since it offers more advanced and realistic depictions compared to 2D. Major industries like gaming, healthcare, entertainment, and real estate have shown high demand for 3D rendering, thereby driving revenue growth. In geographic terms, regions with advanced technology infrastructure, like North America and Europe, are significant contributors owing to presence of key industries and leading market players. Regulatory policies have also played role in driving this growth since the mandate for improving visual communication standards across industries has led to increased adoption of 3D technology. Furthermore, the purchasing criteria often prioritize quality and realism for which 3D serves as a preferable choice. The presence of well-established distribution channels for 3D technology products further supports this trend.

Fastest CAGR

2D

Forecast Period Growth Leader

The 2D surface type segment is expected to show the fastest growth. Despite, 3D's dominance, 2D's simpler and cost-effective solutions continue to catalyze its growth, especially in regions with developing technological infrastructure. Emerging sectors, like online education and digital marketing are increasingly adopting 2D animations for operational efficiency and consumer engagement. Its widespread adoption can be credited to technological advancements, increasing industry collaborations, and capital investment in research and development. Regulatory policies supporting digital transformation across various sectors have encouraged extensive use of 2D graphics. But market must recognize potential risks associated with software piracy and copyright issues, which are prevalent in 2D and can hinder its fast growth.

By System

The market under System segment is divided into subsegments including Computer-Based Systems and Camera-Based Systems. In 2024, Computer-Based Systems held the largest revenue share, while Camera-Based Systems are anticipated to record the fastest growth rate.

Largest Revenue Share

Computer-Based Systems

Market Share Leader

As of base year 2024, Computer-Based Systems have dominated Systems market in terms of revenue. The dominance is mainly due to their widespread usage in a wide range of industries. From finance and healthcare to education and transportation, computer-based systems are indispensable tools. They offer automation capabilities, increased efficiency, communication facilities and allow for streamlined business processes. Their indispensable role in data processing, management, storage, and analysis also contribute to revenue growth. Moreover, advancements in technology, paired with increased accessibility and affordability, have led to higher adoption rates driving up demand. Geographically, developed regions with well-established technology infrastructure, like North America and Europe, hold significant market shares. But rapid digitalization in developing economies can't be overlooked as it constitutes a significant portion of segment revenue.

Fastest CAGR

Camera-Based Systems

Forecast Period Growth Leader

Camera-Based Systems, though not leading subsegment in terms of revenue currently, are projected to show highest CAGR in forthcoming years. Several growth factors are influencing this rapid expansion. Rise in security and surveillance needs across various sectors is the key demand driver. Additionally, technological innovations like AI integrations, IoT, and face recognition, are propelling adoption of advanced camera-based systems. Hybrid environments combining physical and digital spaces, like those in remote work or learning setups, boost demand. Despite these growth drivers, there exist barriers like initial cost of installation and privacy concerns that could slow down adoption rate. Policy reforms concerning privacy protection could either hinder or catalyze the market growth, depending on their nature and strictness. Nonetheless, partnerships among tech firms aimed at product enhancement can help overcome the adoption barriers.

By End-Use Industry

The market is divided into subsegments including Automotive, Electronics, Medical, Packaging, Aerospace, and Others. In the base year 2024, the Automotive industry accounted for the largest revenue share while the Medical industry is anticipated to grow at the fastest CAGR during the forecast period.

Largest Revenue Share

Automotive

Market Share Leader

The Automotive subsegment leads in revenue generation due to combination of factors including continuous growth in automobile production, increasing demand for more advanced and complex electronic systems in vehicles, as well as stringent regulatory requirements for safety and fuel efficiency. A trend towards electrification and autonomous driving further drives demand for vehicle electronics, enhancing growth in this segment. Other drivers can be attributed to rise in disposable income levels which has led to an increase in vehicle purchases, particularly in emerging economies. Conversely, evolving consumer digital lifestyle and integration of advanced safety systems are boosting demand for automotive electronics. This is then driving overall market growth for this particular segment. From geographical perspective, Asia Pacific region, characterized by a robust automotive manufacturing industry, contributes significantly to revenue generation within this subsegment.

Fastest CAGR

Medical

Forecast Period Growth Leader

Medical subsegment is expected to expand at the fastest CAGR primarily due to advancements in medical technology and the increasing demand for medical electronic devices for various health-related services. Recent innovations like smart wearable medical devices, telemedicine services, and artificial intelligence-driven diagnostic tools are driving growth in this segment. Investing in development of these technologies has been a significant factor in stimulating market growth. Another key driver is aging global population, which results in higher demand for medical services and consequently, greater application of electronics in healthcare industry. Regulatory support and increased healthcare expenditure continue to drive market growth within this segment. But growth could face some short-term hurdles due to cost restrictions and stringent regulations regarding the approval of medical electronic devices.

Competitive Analysis

Key Market Players

Manufacturers / OEMs

Cognex Corporation
US
Keyence Corporation
Japan
ISRA VISION AG
Germany

Key Suppliers & Raw Materials

Omron Corporation
Japan
Basler AG
Germany
Teledyne DALSA
Canada

Distributors, Integrators & Channel Partners

National Instruments
US
AMETEK Surface Vision
US
Perceptron, Inc.
US

Porter’s Five Forces Analysis

A critical assessment of Surface Vision and Inspection Market's structure and competitive dynamics.

Supplier Bargaining Power

Medium

Multiple suppliers with specialty components driving up negotiation power.

Buyer Bargaining Power

High

Large buyers dominate the market with their high volume purchase requirements.

Threat of Substitutes

Low

Technological specificity and superior performance render substitutes inferior, reducing the threat.

Threat of New Entrants

Medium

Technical expertise and high setup costs form semi-strong entry barriers for new entrants.

Competitive Rivalry

High

Fierce competition between established brands constantly drives technological innovation.

Regional Analysis

Geographic market dynamics and growth opportunities across key regions

Global Market Outlook

surface-vision-and-inspection-market market regional share

North America

In 2024, surface vision and inspection market in North America witnessed significant growth due to various driving factors and emerging trends. Key drivers include increased demand for automated inspection systems in manufacturing industries and strict government regulations on product standardization. A rise in foreign direct investments (FDIs) in U.S., Canada and Mexico drove adoption of advanced SVI technologies. Rising influence of Industry 4.0, particularly in sectors such as automobile, semiconductor and medical devices drove further expansion of SVI market.

Integration of AI and machine learning in SVI systems led towards driving for increased autonomous and reduction of errors in inspection processes. Ongoing shift in consumer behavior, especially a demand for high-quality, defect-free products, increased these technological shifts. Notably, major partnerships were witnessed between major players of industry like collaboration between Rockwell Automation and Cognex Corporation. With the increased focus on quality control in sectors like energy and utilities has shifted policy enforcement, leading to stricter compliance to standard inspection protocols. Thus, North America significantly contributed the market growth.

Asia Pacific

In 2024, Surface Vision & Inspection Market in Asia Pacific witnessed significantly increased technological adoption across various industries. Due to the increasing requirement of advanced automation from various sectors including rising demands from manufacturing, healthcare and retail sectors. Factors like regulatory guidelines promoting technological adoption in China, India and ASEAN markets increased the investment. Additionally, favorable supply dynamics and competitive pricing strategies substantially contributed to market expansion.

Notably, a shift towards artificial intelligence-based inspection systems were witnessed by technologically developed regions such as Japan, China and South Korea. Demand for high-speed inspections in Australia's mining sector indicated the enhanced product capability. Channel dynamics indicated increased reliance on digital platforms for sales with visible trend of industry leaders partnering for innovation. Whereas policy enforcement in India impacted quality control in pharma manufacturing sector, with noticeable voluntary adoption in China's expansive manufacturing sector. Increased use in Australian utilities for infrastructure management highlighted key government usage. Included by the rise in ASEAN retail driven by data-driven quality checks. Thus, surface vision & inspection market in Asia Pacific showed significant traction and evolving market trends in 2024.

Europe

In 2024, the European surface vision & inspection market highlighted significant expansion fueled by various key drivers and trends. Increased implementation of automation within manufacturing sector acted as a substantial demand factor, growing particularly in automotive industry in regions such as Germany and Italy. Favorable regulations encouraging technological innovation, notably in United Kingdom and the Nordics, further drove market growth. Investment in inspection tools became widespread across sectors, including healthcare and utilities majorly for enhancing productivity and precision.

Simultaneously, the increased adoption of AI and machine learning highlighted a technological shift majorly in Spain and Central & Eastern Europe. Channel dynamics witnessed trend with businesses partnering with digital platforms to deliver surface vision and inspection solutions. With frequent partnerships and acquisitions companies sought competitive advantage, with notably in Benelux's manufacturing sector and France's retail industry. The enforcement of stringent quality standards across many sectors, particularly in United Kingdom's government contracts, played a major role in surface vision and inspection technology. Thus, the market reflected the integration of technology and innovation, majorly influenced by regulatory, investment and sectorial drivers.

Latin America

In 2024, the LATAM surface vision & inspection market highlighted by increased demand and technological advancements. Driving factors included stringent quality assurance policies in manufacturing sectors, especially Brazil's automotive and Argentina's food and beverage industries, indicating increased need for precision inspection systems. With another driver included investment in automated technologies across manufacturing in Mexico. Increasing concerns for public safety drove surveillance infrastructure upgrades in Colombia, further boosting demand. With improved sensor resolution capabilities and reduced machine vision system pricing further drove the market growth.

With trends like buyers indicating increased awareness with subsequently favoring extensive machine vision solutions instead of independent inspection systems. Whereas, in Chile enhancing productivity while reducing costs. Among technology shifts, adoption of 3D surface vision systems in Peru's mining industry recognized for real-time monitoring and on-site safety. With increased partnerships between multinational automation firms partnering with regional vendors for enhanced local product access. Thus, a strong inclination towards industry standards compliance encouraged manufacturers in Mexico to adopt inspection systems, indicating a shift in policy adherence.

Middle East & Africa

In 2024, surface vision & inspection market within Middle East and Africa was significantly marked by technological advancement and investment. Major drivers included increased demand for quality inspection due to strict industrial standards in countries like Saudi Arabia, UAE, Qatar and Nigeria, particularly within oil, gas and manufacturing sectors. Technology adoption driven by increased investments in advanced systems, led by countries like Israel and South Africa, subsequently accelerating supply dynamics.

Shifting trends signified shifting landscape of the market. A noticeable preference for automated over manual inspection solutions, given their higher precision rates majorly in countries like Egypt and Kenya. Furthermore, emergence of 3D vision technology highlighted features, driven by demand in high-tech sectors like telecoms and healthcare. Additionally, with notable partnerships and mergers, especially in UAE and Saudi Arabia where major corporations seek to enhance their capabilities through collaborations. Large customer sectors included government, oil and gas, utilities, telecom, healthcare, manufacturing, retail and financial services, which demanded innovative inspection solutions to maintain quality and efficiency of operations. Thus, for instance, Israel’s healthcare sector was prominently involved in using advanced surface vision technologies, while Egypt's manufacturing sector significantly influenced the market by investing in efficient inspection systems.

Recent Industry Developments

Latest market innovations, product launches, and strategic initiatives

April 2026

KOCKS and LAP announced an expansion of their joint 4D EAGLE S product portfolio with a new high-precision laser measuring system specifically designed for surface inspection and profile measurement of long steel products with larger bar and tube dimensions.

January 2026

AMETEK Micro-Poise deployed next-generation uniformity measurement system that integrates predictive analytics to analyze historical data streams, shifting surface and structural inspection from reactive defect detection to predictive quality control before a defective unit is fully produced.

January 2025

Rockwell Automation launched FactoryTalk Analytics VisionAI, a no-code, edge-to-cloud platform that enables manufacturers to utilize artificial intelligence for identifying subtle surface anomalies and executing real-time quality control decisions without needing data science expertise.

Frequently Asked Questions