Plant Phenotyping Equipment Market Snapshot

Key Players

  • LemnaTec GmbH (Germany)
  • Phenospex B.V. (Netherlands)
  • WPS Horti Systems B.V. (Netherlands)
  • Qubit Systems Inc. (Canada)
  • ARVALIS Institut du vegetal (France)
  • Dynamax Inc (USA)
  • Photon Systems Instruments spol. s r.o. (Czech Republic)
  • Heinz Walz GmbH (Germany)
  • CropDesign N.V. (Belgium)
  • Singhania System Technologists Pvt. Ltd. (India)

Market Size

Base Year 2024
$0.438 Bn
CAGR
10.98%
Forecast 2034
$1.241 Bn

Market Segments

By Equipment
  • Hardware
  • Software
By Application
  • Plant Research
  • Breeding
  • Product Development
  • Quality Assessment
By End Use
  • Greenhouse
  • Field
  • Laboratory
  • Others

Market Dynamics

Drivers
  • Rising demand for high-throughput phenotyping
  • Advanced agricultural research advancements
Restraints
  • High equipment costs
  • Limited technical knowledge
Opportunities
  • Rapid technological advancements
  • Increasing demand in agriculture

Market Size

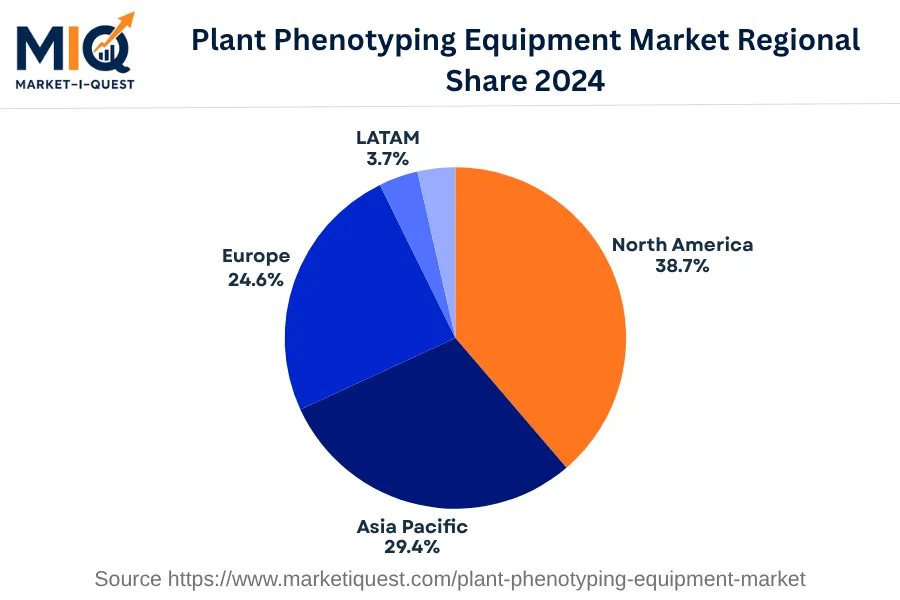
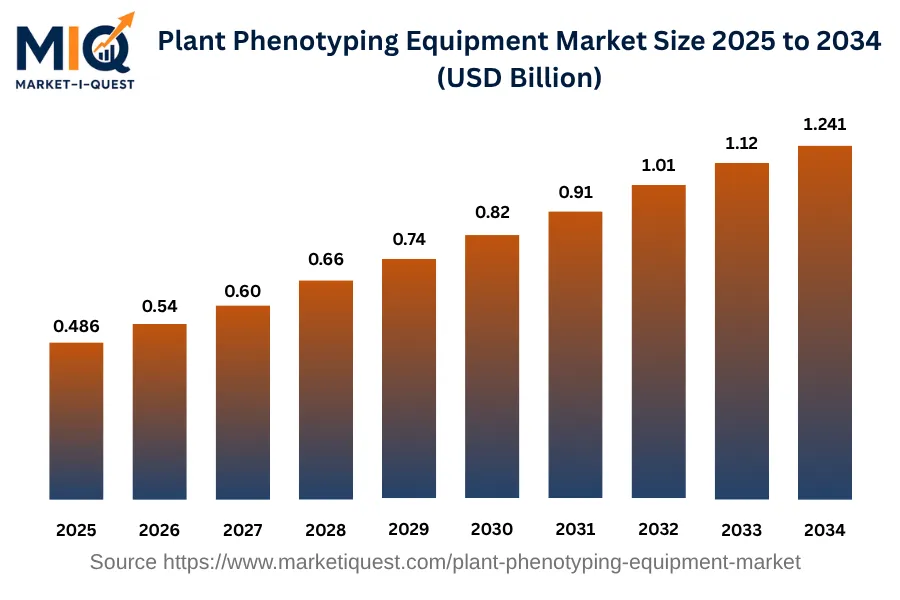
The Plant Phenotyping Equipment Market is predicted to have a substantial growth from 2025 to 2034. In 2025, it was valued at $0.49 billion and is forecast to expand to a value of $1.24 billion by 2034, representing a compound annual growth rate (CAGR) of 10.98%. This strong market growth from 2025 to 2034 stems from an increase in the adoption of this technology over the recent years. Over its growth trajectory, certain years serve as key milestones - 2024, with a market size of $0.44 billion, 2025 with $0.49 billion, and 2034 expected to reach $1.24 billion. In 2024, the regional market shares were distributed as follows: North America held a dominating share of 38.72%, closely followed by the Asia Pacific at 29.41%, and Europe at 24.58%. LATAM and MEA regions had the smallest market shares at 3.71% and 3.58% respectively, but nonetheless form an integral part of the global market.

Key Takeaways

  • By Equipment - Hardware held a significant position leading the Plant Phenotyping Equipment Market in the base year.
  • By Application - Quality Assessment emerged as a dominant segment contributing majorly to the market growth.
  • By End Use - Field subsegment led the market accounting for a notable share in the base year.
plant-phenotyping-equipment-market market size

Key Driving Factors

Adoption of High-Throughput Screening in Agriculture

The adoption of high-throughput screening (HTS) in the field of agriculture research and breeding is one of the key drivers of the Plant Phenotyping Equipment Market. HTS is a method used for experimentation, testing and breeding new crops, and it necessitates the use of plant phenotyping tools. Agriculture research institutes and commercial seed production companies are leveraging HTS to assess the genetic makeup of crops and examine their growth patterns under different environmental conditions. This increases the need for robust and precise plant phenotyping equipment, which in turn spurs the growth of this market.

Shift from Field-Based Studies to Controlled Environment Agriculture

Transformations in agriculture practices are largely shifting from traditional, field-based studies to Controlled Environment Agriculture (CEA) to achieve higher crop yield and sustainability. CEA is the practice of cultivating plants in controlled environments, such as greenhouses or vertical farms, where all aspects of plant growth, including light, temperature, and humidity, can be closely monitored and adjusted. This allows for increased crop yield and quality, regardless of outdoor weather conditions. Plant phenotyping equipment enables close and precise monitoring of these growing conditions, making them critical components in CEA setups. This practical shift contributes significantly to the growing demand for plant phenotyping equipment.

Market Evolution by Timeline

2019-2023
The period between 2019 and 2023 saw significant improvements in technology and demand surges in the Plant Phenotyping Equipment Market. Universities and research institutions were top buyers, relying on the equipment for data-driven crop research. European countries demonstrated the highest demand, partly due to their increasing focus on agri-tech advancements and precise farming techniques. The advancement in high-throughput phenotyping significantly revolutionized the supply side with automated imaging platforms coming into being. However, the complexity of integrating this technology created constraints. The period saw no new major regulations affecting the market. However, the common industry standards like ISO 22000 and ISO 9001 still influenced the operations. Pricing tendencies leaned towards value-based models and annual contract types dominated. Despite these advancements, high equipment costs and technical knowledge requirements were key barriers for many potential buyers.
2024
In 2024, there was a particularly high demand of plant phenotyping equipment from biotechnology companies and agri-businesses in the USA and Asia, likely due to the increasing embracement of precision agriculture and digital farming. Supply-wise, portable rapid phenotyping systems gained substantial market traction. This advancement, however, posed challenge in terms of data management. New policies didn't have a significant impact, the adoption was still under standards like Good Laboratory Practice (GLP) and Good Manufacturing Practice (GMP). Competitive pricing models were observed with manufacturers offering cost-effective solutions to meet the increasing demand. Despite these strides, inappropriate data interpretation and lack of proper training still acted as potential roadblocks for wider adoption of the technology.
2025-2029
The market evolution for Plant Phenotyping Equipment continued between 2025 and 2029, with the market seeing higher demand from big agritech corporations and private research labs. North America and Asia, with their focus on high-tech agriculture, accounted for the majority of the demand. The industry's remote sensing technology matured during this period, making equipment more affordable and user-interactive. However, they had to work under existing protocols like the Regulation on precision farming (EU 2019/1009). The pricing noticeably pivoted towards flexible, subscription-based models. Industry-wide collaboration became more common, assisting in scaling the solutions. The main challenge in this period, however, was converting raw data into actionable intelligence for crop improvement.
2030-2034
During 2030 to 2034, large agricultural cooperatives and government research bodies have shown the highest demand for plant phenotyping equipment. Regions with best traction include Scandinavia and Oceania, due to their focus on sustainable farming practices. The supply side observed a rise in high-precision multispectral sensors, but the widespread implementation hit a snag because of steep learning curves and high upfront costs. No new regulations were brought forward, adhering to frameworks like National Plant Phenotyping Infrastructure (NPPINFRA) continued. Desktop-as-a-Service (DaaS) pricing model witnessed higher acceptance among users. However, the consistently outlined challenge remained the need for comprehensive training programs to ensure efficient usage of this highly specialized equipment.

Future Market Outlook

Future Opportunities

The future of the plant phenotyping equipment market is poised for growth driven by the increasing focus on sustainable agriculture and food security. Governments worldwide, particularly in the European Union, are implementing policies that emphasize the importance of precision agriculture; the EU's Farm to Fork Strategy, launched in 2020, aims to reduce the environmental impact of farming while ensuring a reliable food supply. This regulatory landscape encourages the adoption of phenotyping technologies to optimize yields and reduce chemical inputs. Additionally, in the United States, the U.S. Department of Agriculture announced funding initiatives aimed at accelerating agricultural technology innovation, including phenotyping tools, highlighting a commitment to enhancing plant research capabilities. Research institutions and universities are capitalizing on these opportunities by investing in interdisciplinary programs that combine plant science with data analytics and robotics. Collaborations between agritech startups and traditional farming operations are growing, as evidenced by partnerships like that of CropX and various agricultural organizations to incorporate soil sensor data into phenotyping frameworks. Furthermore, emerging markets in Asia and Africa are equally recognized for their potential; initiatives such as the African Centre for Crop Improvement are focusing on using advanced phenotyping methods to address local agricultural challenges. These developments illuminate a promising trajectory for the plant phenotyping equipment market, fostering advancements that align with global food security goals.

Segmentation Analysis

By Equipment

The market is divided into two significant equipment-based subsegments, namely hardware and software. The hardware subsegment accounted for the largest revenue share in 2024, while the software subsegment is expected to grow at the fastest CAGR during the forecast period.

Largest Revenue Share

Hardware

Market Share Leader

In the base year of 2024, hardware stood out as the subsegment yielding the most revenue. The primary reason underpinning this trend pertains to the intrinsic value of hardware as a crucial component for most tech systems. Hardware forms the tangible and integral part of computers, data centers, servers, and other technological infrastructures that most businesses heavily rely on. Hence, the demand for hardware equipment is considerably high. This is especially pronounced in emerging markets where businesses scale their operations, requiring extensive hardware procurement and upgrades. Another growth driver is the steady rate of technological advancement, pushing for regular system updates that render old hardware obsolete. In terms of purchasing criteria, customers often prioritize hardware specifications, reliability, and brand reputation. Lastly, the expansion of e-commerce channels has facilitated broader accessibility and purchase of hardware globally. However, it's important to note that in mature markets or in industries where hardware is much commoditized, trend may deviate.

Fastest CAGR

Software

Forecast Period Growth Leader

On the flip side, the software subsegment is poised to outpace hardware in terms of growth rate within the forecast period. Several factors catalyze this development. The ever-increasing adoption of digital solutions across industries has spiked demand for more sophisticated and tailored software products. Industries are actively seeking automation and digital transformation, which directly boosts software sales. Moreover, the proliferation of Software as a Service (SaaS) model enables a cost-effective and flexible way for businesses to incorporate advanced software into their operations. However, there are barriers inhibiting full adoption, including concerns over security, the need for technical expertise, and resistance to change from traditional systems. While initial expenditure for software implementation can be hefty, the long-term cost saving and efficiency benefits generally offer a compelling case for switch. Looking into the near future, potential risks could be regulatory policies towards data privacy and claims over software licensing.

By Application

The market is divided into subsegments including Plant Research, Breeding, Product Development, and Quality Assessment, with Quality Assessment accounting for the largest revenue share, while Product Development is expected to grow at the fastest CAGR during the forecast period.

Largest Revenue Share

Quality Assessment

Market Share Leader

Quality Assessment has pushed its way to the front of the market in terms of revenue; it is pivotal to every part of agriculture and food production. The driving factor is the consumer's rising preference for high-quality agricultural products and foodstuffs. Furthermore, regulatory bodies across the globe have stringent quality standards for plants and crops, giving impetus to this subsegment. Consumers usually place a premium on quality, making Quality Assessment a lucrative area. Purchasing decisions are often tethered to the assurance of quality, thereby solidifying the position of Quality Assessment in the market. Moreover, the increasing partnership between food producers and quality assessment service providers speaks of the importance of quality check in plant research, breeding, and product development segments.

Fastest CAGR

Product Development

Forecast Period Growth Leader

Product Development stands as the subsegment expected to grow at the fastest CAGR in the forthcoming period. The rapid pace of advancement in agricultural technology, coupled with a dire need for crop diversity and yield improvement, fuels the growth. The demand for new, resilient plant varieties that can withstand extreme weather conditions and diseases is accelerating product development in the industry. Besides, the rising policy support and funding opportunities for the development of novel agricultural techniques and strategies are likely to catalyze the market growth. However, challenges like adoption barriers in less developed regions and the lengthy process of developing new products are posing as potential risks to the rapid growth trajectory. Yet, partnerships between technologists and agriculturalists, and investments in research and development should keep the momentum going.

By End Use

The market is divided into subsegments including Greenhouse, Field, Laboratory, and Others. In 2024, the Field subsegment accounted for the largest revenue share while Greenhouse is expected to grow at the fastest CAGR during the forecast period.

Largest Revenue Share

Field

Market Share Leader

In the base year 2024, the 'Field' subsegment lead the market in terms of revenue. This dominance can be attributed to several key factors. First, field research offers real-world data and practical experience, which is essential in many industries, especially in agriculture and environmental science. The vast volume of these field operations requires significant equipment and resources, leading to high revenues. Geographically, this segment is prominent in agriculturally dense regions with favorable growth conditions. Regulatory support for field research in various countries also contributes to its revenue generation. Purchasing criteria in this segment are highly dictated by the quality, durability, and reliability of equipment and services, giving an upper hand to established providers. Switching costs are high in this segment due to the long-term investment in equipment and the level of expertise required to operate in the field. Resellers and direct sales are the primary sales channels in this segment, providing further control over pricing and revenue generation.

Fastest CAGR

Greenhouse

Forecast Period Growth Leader

The 'Greenhouse' subsegment is expected to grow at the fastest CAGR. Numerous growth drivers are steering this trend, the foremost being the rising adoption of controlled environment agriculture (CEA). CEA technology allows for year-round crop production, irrespective of weather conditions, leading to increased yields and sustainability. Policy support for sustainable farming practices and food security are other catalysts propelling growth in this subsegment. However, the high initial capital expenditure can act as an adoption barrier. But, it’s offset by the long-term gains achieved through consistent and enhanced crop production. Partnerships with tech companies providing automation and artificial intelligence-based solutions can also boost growth by increasing operational efficiencies. As a note of caution, near-term risks include climatic anomalies and policy shifts, which may impact the growth rate of this subsegment.

Competitive Analysis

Key Market Players

Manufacturers / OEMs

LemnaTec GmbH
Germany
Heinz Walz GmbH
Germany
Phenospex B.V.
Netherlands

Key Suppliers & Raw Materials

PhenoVation B.V.
Netherlands
PSI (Photon Systems Instruments) Spol. S.R.O
Czech Republic
Conviron
Canada

Distributors, Integrators & Channel Partners

Wagner Instruments
US
The Scientifica Group
UK
RDM Test Equipment
UK

Porter’s Five Forces Analysis

Assessment of competitive dynamics and market forces influencing the plant phenotyping equipment market.

Supplier Bargaining Power

Low

Abundant suppliers and standardized equipment components diminish supplier bargaining power.

Buyer Bargaining Power

Medium

Diverse product offerings, but high training and switching costs limit buyer power.

Threat of Substitutes

Low

No effective substitutes for advanced phenotyping equipment in precision agriculture exist.

Threat of New Entrants

High

Technology advancements and interest in precision farming lowers barriers for new entrants.

Competitive Rivalry

Medium

Competition is moderate due to presence of dominant players and niche market offerings.

Regional Analysis

Geographic market dynamics and growth opportunities across key regions

Global Market Outlook

plant-phenotyping-equipment-market market regional share

North America

In 2024, the North American Plant Phenotyping Equipment Market has exhibited significant growth owing to various factors driving this sector. Key drivers include the escalating demand for sustainable agriculture practices amidst increasing food security concerns, substantial funding from government bodies for agricultural research, and rapid technology adoption of machine learning and artificial intelligence in plant phenotyping. Additionally, the declining cost of phenotyping technologies is enhancing its affordability amongst users. Trends observed in this market include a shift towards high-throughput screening technologies, advanced imaging techniques and increasing usage of unmanned aerial vehicles (UAVs) for field phenotyping. An emerging trend is marked by collaboration amongst key market players along with research institutions to develop and optimize novel phenotyping solutions. Regulatory support is becoming evident with policies advocating sustainable farming practices are also driving technology adoption.

The major consumers of plant phenotyping equipment are horticultural industries, governmental agricultural bodies, and research institutions. Sectors showing a keen interest include manufacturing and pharmaceuticals, particularly in the U.S. and Canada where intensive research and development is being undertaken. In Mexico, the trend of adopting these technologies is steadily rising due to government initiatives towards sustainable farming, notwithstanding the increasing prevalence of tech-enabled farming practices across all three regions.

Asia Pacific

In 2024, the Asia Pacific Plant Phenotyping Equipment Market presented a vibrant picture, driven by a combination of factors. Demand was largely fueled by increased agricultural advancements in India and China, as both governments prioritized food security and efficient farming practices. Additionally, Australia's high investment in agri-tech innovation bolstered the market's growth. A faster adoption of technology, seen in Japan and South Korea's automated phenotyping systems, underscored the supply dynamics. Market trends reflected a turn towards sustainability, with more buyers preferring eco-friendly equipment. A major shift was observed in the wider acceptance of non-invasive phenotyping technology, noted particularly in China’s and India’s high throughput screening of crops. The importance of partnerships and mergers became evident, as evident in Japan’s joint ventures with global phenotyping solutions providers. Implementation of standards, such as Australia's Phenomics Infrastructure Plan, underscored the policy enforcement trend.

This market impacted multiple sectors. Government programs in the key ASEAN markets accelerated technology acceptance, while healthcare industries across the region relied upon it for medicinal plant phenotyping. Manufacturing firms met increased demand by expanding production capacities, and retail channels benefited from increased sales, particularly through online platforms. Overall, the dynamic interplay of drivers and trends fueled the robust growth of the plant phenotyping equipment market in the Asia Pacific region in 2024.

Europe

In 2024, the plant phenotyping equipment market in Europe experienced significant motion. Driver factors included increased funding towards agribusiness research by governments across Germany, the United Kingdom, and France, propelling demand for advanced phenotyping technologies. The implementation of stringent agricultural policies, particularly in the Nordics and Benelux, also stimulated need for precise plant inspection mechanisms. The adaption of Internet of Things (IoT) technology within the agricultural sector demonstrated increased efficiency, thereby escalating the adoption rate of smart phenotyping equipment.

Amidst trends, a notable shift was observed in buyer behavior, leaning towards automated, high-throughput plant phenotyping equipment. This was largely driven by the expanding enterprise sector in Central & Eastern Europe and Italy. Accelerated by the digitization in agriculture, there was an increased push for collaborations between technology firms and agricultural researchers to develop customized solutions. Notably, the sustainability movement in Europe reinforced strict policy enforcement, thereby encouraging the agricultural sector to adopt environmentally friendly technologies, including non-invasive plant phenotyping equipment. For example, several retail giants turned to local farms deploying phenotyping techniques to secure fresh produce, given their commitment to sustainable sourcing. The emphasis within the European market for plant phenotyping equipment in 2024 was on integration, precision, and sustainability, reflecting shifts in legislation, technology, and societal values.

Latin America

In 2024, the Latin America Plant Phenotyping Equipment Market demonstrated significant growth, driven by several specific factors. Stringent regulatory frameworks for agriculture set by Brazilian and Colombian governments drove demand for plant phenotyping equipment. Also, substantial investments from Mexico and Peru in agritech spurred technology adoption, particularly in precision agriculture. Argentina's commitment to enhancing agricultural productivity increased the supply dynamics, optimising the availability of these tools in the LATAM market. On the trends side, agricultural enterprises in Chile displayed a shift towards non-invasive, image-based plant phenotyping systems. In Brazil, we observed new partnerships between agritech firms and research institutes aimed at improving crop phenotyping. In Mexico, there was increased enforcement of policies promoting sustainable agriculture, driving demand for more efficient, environmentally friendly phenotyping processes.

Several market sectors played into these dynamics. Key customers included large agricultural enterprises in Brazil and Mexico, as well as government-backed agricultural initiatives in Colombia. We also saw increased interest from manufacturing companies in Argentina, reflecting the widening applications of plant phenotyping technologies. The retail sector, particularly in Peru and Chile, saw demand increases as they began accommodating tools for urban agriculture and indoor farming. Overall, the base year mirrored an uptick in both supply and demand, with growing awareness and enforcement of sustainable agricultural practices guided by precise phenotyping equipment.

Middle East & Africa

In 2024, the Plant Phenotyping Equipment Market in the Middle East and Africa was shaped by a variety of factors. Due to a growing focus on plant research within the region, the demand for phenotyping equipment increased significantly. Region-specific policies promoting sustainability, such as Saudi Arabia's "Vision 2030," enhanced the relevance of this market, encouraging adoption of advanced phenotyping technology. In countries like South Africa and Israel, increased investments to boost agricultural productivity acted as another driver for this market growth.

A shift was noticed in buyer behavior, with more emphasis on technology-based solutions for plant study. This trend was most noticeable in technologically advanced countries, such as the United Arab Emirates and Israel. The market experienced a surge in partnerships and Mergers & Acquisitions, particularly in Egypt and Nigeria. These collaborations aimed to enhance product capabilities and expand within the market. The market saw a heightened demand from sectors such as government research institutions and the agricultural industry due to their increasing need for efficient phenotyping equipment. The predominant transaction channel shifted to online platforms, simplifying the procurement process for buyers. As a result, countries like Kenya and Qatar observed a rise in the sale of plant phenotyping equipment. This shift underscored a larger trend towards digital solutions across different sectors within the market landscape.

Recent Industry Developments

Latest market innovations, product launches, and strategic initiatives

April 2026

VITO and Wageningen University & Research Strategic Partnership – VITO and Wageningen University & Research entered into a strategic partnership to advance drone-based data processing for plant phenotyping, combining expertise in remote sensing, AI, and field-scale crop monitoring through the MAPEO drone data processing platform.

February 2026

LemnaTec Launches PhenoAIxpert CF – LemnaTec released the PhenoAIxpert CF, a non-destructive chlorophyll fluorescence phenotyping system for potted plants including crops and vegetables, featuring multispectral and color phenotyping capabilities for plants up to 1000mm or 2000mm depending on cabinet size.

Frequently Asked Questions