Optical Sorter Market Snapshot

Key Players

  • TOMRA Systems ASA (Norway)
  • Bühler Group (Switzerland)
  • Key Technology (United States)
  • Satake Corporation (Japan)
  • Raytec Vision SpA (Italy)
  • Meyer Corporation (Taiwan)
  • Anhui Zhongke Optic-electronic Color Sorter Machinery Co. Ltd. (China)
  • Cimbria Heid GmbH (Austria)
  • Allgaier Werke GmbH (Germany)
  • National Recovery Technologies (United States)

Market Size

Base Year 2024
$3.85 Bn
CAGR
10.8%
Forecast 2034
$10.74 Bn

Market Segments

By Technology
Cameras, Lasers, NIR Sorters, Hyperspectral Cameras, Combined Sorters, Others
By Platform
Belt, Freefall, Lane, Hybrid
By Application
Food Processing, Recycling, Minerals & Precious Metals Sorting, Tablets & Capsules Inspection Process, Others
By End User
Food & Beverages, Pharmaceuticals, Mining, Waste Management, Others

Market Dynamics

Drivers
  • Technological advancements
  • Rising automation demand
Restraints
  • High equipment cost
  • Lack of technical expertise
Opportunities
  • Technological advancements in sorting
  • Increasing recycling needs worldwide

Market Size

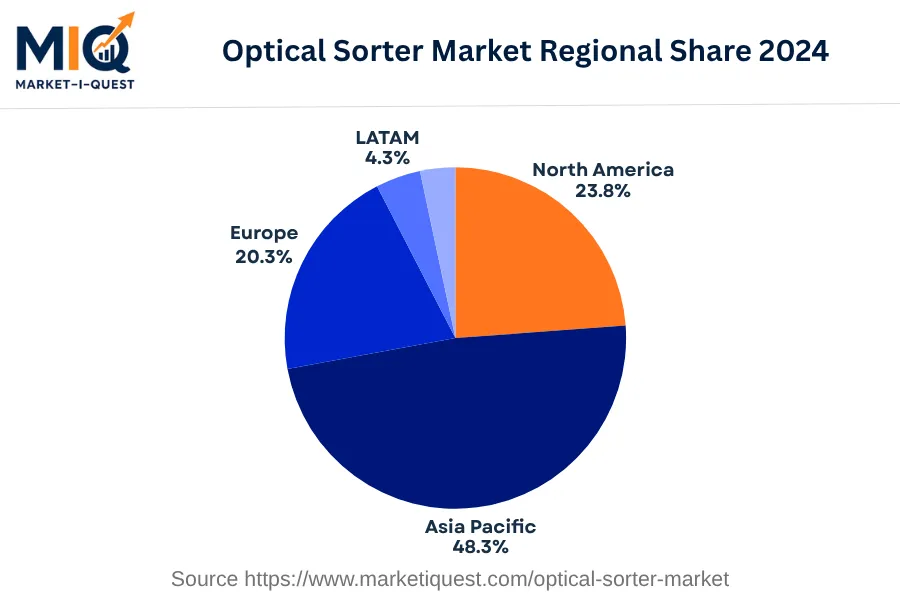
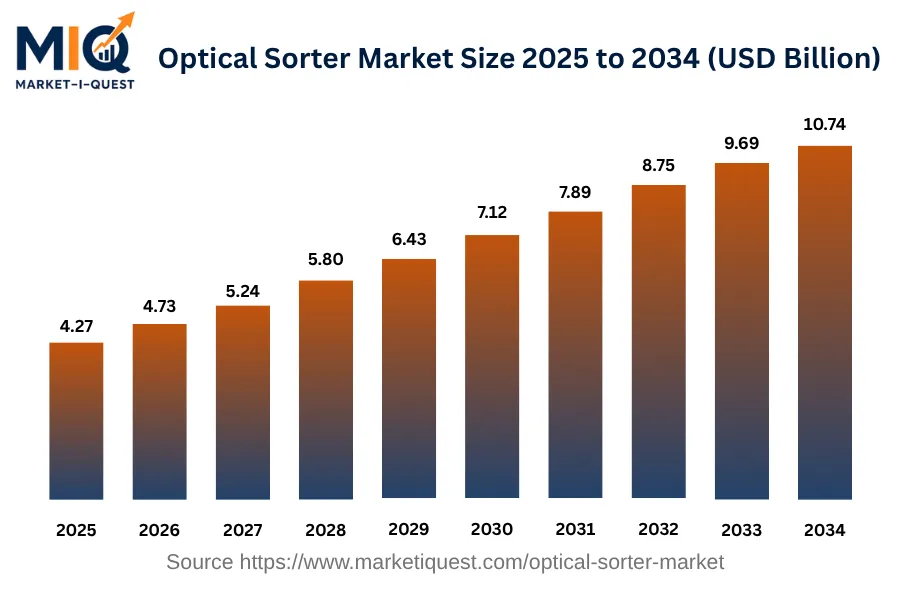
The Optical Sorter market size was $4.27 billion in 2025 and is projected to reach $10.74 billion by 2034, growing at a CAGR of 10.8%. The market demonstrates a notable escalation from the $3.85 billion value observed in 2024. The appreciable expansion of the Optical Sorter market size over this decade-long period can be attributed to continual technological advancements in the field and increased demand across various application sectors. The regional distribution of the Optical Sorter market in 2024 was as follows: Asia Pacific held the largest share at 48.3%, North America accounted for 23.8%, Europe constituted 20.3%, while Latin America (LATAM) and the Middle East and Africa (MEA) marked lower shares with 4.3% and 3.3%, respectively.

Key Takeaways

  • By Technology - Cameras lead accounting for a significant share in the recent base year.
  • By Platform - Belt systems were the predominant choice securing a leading market position.
  • By Application - Food Processing took the front seat representing the largest segment as of the base year.
  • By End User - Food & Beverages industry was the largest contributor dominating the Optical Sorter Market.
optical-sorter-market market size

Key Driving Factors

Strict Food Safety Regulations

In the food industry, maintaining product quality and safety is crucial, especially with regulatory restrictions tightening across regions. To achieve this, many companies are now integrating optical sorters into their production lines. These machines are capable of recognizing and removing items based on color and size, making them efficient in ensuring that only items which meet the quality criteria are packaged. Regulatory bodies like the FDA in the U.S. and EU's equivalent regulatory agencies demand strict adherence to food safety guidelines, driving companies to adopt this technology for real-time decision making and improving quality checks. Bottom line, stronger food safety regulations are one of the key factors driving the adoption of optical sorters in food processing sectors.

Rising Focus on Reducing Process Wastage

There is also a rising focus on reducing process wastage among several industries, which is a substantial driving factor for the optical sorter market. These machines enable industries to cut down on their waste significantly. For instance, in recycling plants, optical sorters are deployed to categorize materials efficiently, increasing the value of the end-product and reducing material sent to landfill. As environmental sustainability becomes increasingly central to business practices, an increasing number of companies are looking to streamline their operations with technologies like optical sorting. Thus, the push towards sustainable practices and the benefits of reduced wastage contribute to the demand for optical sorters.

Market Evolution by Timeline

2019-2023
During 2019-2023, the food processing industry, especially in North America and Europe, heavily adopted optical sorting technology for quality control. Manufacturers offered optical sorting machines integrated with advanced data management systems. Yet, high cost of sorting equipment made small and medium enterprises hesitant. In the policy area, EU regulations on waste management, such as the Waste Electrical and Electronic Equipment Directive, encouraged recycling firms to use optical sorters. The technology was typically procured via licensing models, with periodic maintenance contracts. The significant risk was the machine's accuracy affected by variations in product characteristics.
2024
In 2024, there was an increase in interest from mining companies, mainly in Australia and Africa, to detect and separate valuable mineral ores. Manufacturers shipped sorter models with enhanced spectral analysis capability providing more precise detection. Strict guidelines over mineral quality by the Australian Government endorsed these machines. While high capital investments posed a risk, lease contracts were offered as mitigation. Further, companies like TOMRA introduced multi-sensor technology-based sorters greatly enhancing the sorting accuracy, thus countering the risk of poor sorting quality due to product heterogeneity.
2025-2029
From 2025 to 2029, waste management authorities from developing Asian countries started using optical sorters which led to a surge in demand. Advanced sorters were piloted, employing AI for real-time decision making. Supply constraints involved integrating AI with existing hardware. Recycling and waste management regulations in countries like India and China necessitated their use. Commercial models transitioned towards rental agreements, critical for affordability in these markets. Maintenance cost, due to rugged use conditions, was flagged as a risk during the procurement.
2030-2034
Between 2030-2034, the e-commerce sector globally exploited the potential of optical sorters in their warehouses for efficient package sorting. The shipping of portable, AI-enabled sorting machines increased. However, the varying shapes and sizes of parcels posed integration challenges. In EU and US, standards like ISO 9001:2030 insisted on efficient packaging and sorting systems. Pricing saw a change with vendors offering sorters on a pay-per-use basis. The biggest risk was sorting errors due to diverse parcel characteristics; advanced training of AI models was the common response.

Future Market Outlook

Future Opportunities

Given current trends in environmental regulations and technological advancements, considerable opportunities exist in the optical sorter market. In July 2023, the United Nations reported that over 200 million tons of recyclables are being improperly sorted, creating a significant gap for optical sorting technologies to fill. This mismanagement of recyclables necessitates enhanced sorting solutions to comply with actual recycling mandates in regions such as North America and Europe. Companies like TOMRA and Rayner Equipment Systems are actively seeking partnerships to develop systems that can efficiently sort a wider range of materials, aligning with these regulatory trends. Additionally, the increasing public awareness regarding food safety standards offers another opportunity for optical sorter manufacturers. In 2022, the Food Safety Modernization Act in the U.S. pushed food processors towards upgrading their sorting infrastructure, thus expanding the market for optical sorting technologies. Emerging markets in Asia, particularly India and China, present unique prospects due to improving regulatory frameworks and the rising demand for high-quality processed food and recyclable materials. By leveraging these opportunities for innovation and compliance, companies in the optical sorter market can position themselves as leaders in sustainability practices and efficiency, responding to immediate environmental and safety needs effectively.

Segmentation Analysis

By Technology

The technology-based market segment is divided into subsegments including Cameras, Lasers, NIR Sorters, Hyperspectral Cameras, Combined Sorters, and Others. Out of these, Cameras accounted for the largest revenue share while Hyperspectral Cameras are expected to grow at the fastest CAGR during the forecast period.

Largest Revenue Share

Cameras

Market Share Leader

Cameras hold the largest market share due to their wide application scope, cost-effectiveness, and high performance across various industry sectors. They serve as a fundamental tool for basic process operations in sectors, including manufacturing, automation, surveillance, and research, contributing to their substantial revenue generation. High demand from developing regions, such as Asia-Pacific and Middle East & Africa, owing to rapid industrialization and urbanization, also fuels the camera technology market. Their user-friendly nature, combined with their capacity to deliver high-quality images, continues to drive their popularity. Advancements in camera technologies, including rapid digitization and introduction of technologies like Machine Vision (MV), also serve to boost their market. Regulatory mandates favoring the use of cameras for safety and quality control further contribute to this. However, the market must adapt to changing consumer preferences and an evolving regulatory environment.

Fastest CAGR

Hyperspectral Cameras

Forecast Period Growth Leader

Despite not currently leading the market in revenue, Hyperspectral Cameras show promising potential for growth. They are expected to register the fastest CAGR during the forecast period. Several growth drivers catalyze this trend. Technological advancements and increased capability to provide detailed imaging across diverse industry applications act as catalysts for their adoption. The unique ability of hyperspectral cameras to capture and processes spectral and spatial information simultaneously gives them an edge over other technologies. Furthermore, the dropping costs of these cameras reduce the initial capex barrier previously associated with them, fueling their demand. Partnerships formed with technology companies to boost innovation also serve to enhance market growth. However, the need for extensive data processing could pose near-term risks and could act as an adoption barrier.

By Platform

The market is divided into subsegments including Belt, Freefall, Lane, and Hybrid, with Belt accounting for the largest revenue share while Lane is expected to grow at the fastest CAGR during the forecast period.

Largest Revenue Share

Belt

Market Share Leader

In 2024, the Belt subsegment dominated the platform market in terms of revenue. This can be attributed to the wide usage of Belt technologies in various industries including manufacturing, transportation, and logistics because of its robust, efficient, and reliable nature. Belts have a proven track record of performance, contributing to the lower total cost of ownership and durability which is a major purchasing criterion for businesses. Geographically, the Belt subsegment thrived in regions with strong industrial sectors such as North America and Asia Pacific. Regulations favoring industrial automation also had a positive impact on the Belt market. The subsegment experienced a lift from the large structural need for smooth and efficient product flow processes, pushing up the demand for Belt systems. Moreover, switching costs for already installed Belt systems is high which helped in retaining its existing customer base, ensuring a steady revenue stream.

Fastest CAGR

Lane

Forecast Period Growth Leader

The Lane subsegment, on the other hand, is projected to exhibit the fastest CAGR during the forecast period. Despite having a smaller market share in the base year 2024, it has shown a significant growth trajectory. This growth can be traced back to several factors including advancements in technology providing enhanced capabilities and improved efficiency. Lane systems are increasingly adopted due to their freer movement and adaptability in various spatial requirements and industry applications. Policy changes supporting industrial automation and advancements in technologies involving IoT and AI have acted as catalysts for the expansion of the Lane market. However, a high initial capital expenditure may act as a barrier to its adoption, though this is being offset by partnerships that enable shared investment and risk. Keeping all these factors in mind, the Lane subsegment is anticipated to outpace others in growth but carries potential risks including tech obsolescence and regulatory changes.

By Application

The market for application includes several subsegments such as Food Processing, Recycling, Minerals & Precious Metals Sorting, Tablets & Capsules Inspection Process, and others. Of these, the Food Processing subsegment holds the largest revenue share while the Tablets & Capsules Inspection Process subsegment is expected to grow at the most rapid pace during the forecast periods.

Largest Revenue Share

Food Processing

Market Share Leader

In the base year 2024, Food Processing, within the application segment, has been found to bring the most revenue. The primary driver behind this is the increasing demand for processed food due to rapidly growing populations and changing lifestyle patterns globally. Furthermore, health and hygiene concerns have fueled processed food's popularity, as these products generally undergo stringent quality checks, thereby providing an additional revenue source to the food processing sector. An evolving and expanding global retail network is also a significant factor, offering easier access to a wide variety of processed foods. More developed regions demonstrate high demand based on higher income levels and preference for convenience and packaged foods. However, the developing regions are also exhibiting significant growth opportunities.

Fastest CAGR

Tablets & Capsules Inspection Process

Forecast Period Growth Leader

The subsegment of Tablets & Capsules Inspection Process, though may not be leading in terms of revenue, is projected to grow at the fastest pace. The escalating growth rate may result from the increasing investment in the pharmaceutical industry to ensure drug quality and safety. Technology advancements, especially automation, offer high-speed inspection while providing accuracy and reducing the risk of false rejections. This innovation favours operational efficiency and quality assurance which inturn boosts adoption among pharmaceutical manufacturers. Policies and regulations also play a notable role, such as stringent oversight by the FDA and similar entities worldwide, pushing for better inspection standards. However, high capital investment could be a limiting factor. Collaboration with tech companies could serve to counterbalance this issue, giving manufacturing companies access to the needed advanced technologies.

By End User

The market is divided into subsegments including Food & Beverages, Pharmaceuticals, Mining, Waste Management, and others. Within these, the Food & Beverages subsegment accounted for the largest revenue share while the Pharmaceuticals is expected to grow at the fastest CAGR during the forecast period.

Largest Revenue Share

Food & Beverages

Market Share Leader

Food & Beverages subsegment is leading the market in terms of revenue generation. This supremacy can be attributed to the ever-increasing global population, skyrocketing consumer awareness about health and wellness, and heightened demand for convenience food. A significant growth driver for this segment is the consistently rising pervasiveness of online food delivery platforms, which has transformed the way consumers purchase food and beverages. Besides, regulatory factors play a role in shaping this segment too. Stricter food quality standards and regulations deployed by food safety authorities worldwide have driven companies to invest more in technologies and processes that guarantee compliance. Hence, all these factors collectively contribute to making Food & Beverages the subsegment commanding the largest revenue share as of the base year 2024.

Fastest CAGR

Pharmaceuticals

Forecast Period Growth Leader

The Pharmaceuticals subsegment is touted to register the highest CAGR going forward. The primary growth catalysts include the advancing healthcare infrastructure, accelerating R&D investments, and increasing global disease burden. With the advent of novel technologies like AI, machine learning, and big data analytics, the pharmaceutical industry has been seeing significant innovation. The impetus provided by regulatory bodies and governments through various support initiatives and funds, especially in regions such as Asia-Pacific and North America, has further created favorable market conditions. Nonetheless, the high-cost associated with drug development and regulatory compliance could potentially act as a barrier to the growth of this subsegment. Therefore, although the Pharmaceuticals subsegment is not the largest in terms of revenue currently, it does hold the potential for the fastest growth in the near future.

Competitive Analysis

Key Market Players

Manufacturers / OEMs

TOMRA Sorting Solutions
Norway
Buhler Sortex Ltd
UK
Satake Corporation
Japan

Key Suppliers & Raw Materials

Edmund Optics Inc
US
Thorlabs Inc
US
Hamamatsu Photonics
Japan

Distributors, Integrators & Channel Partners

National Recovery Technologies (NRT)
US
Sesotec GmbH
Germany
Eagle Optical Sorting Systems
US

Porter’s Five Forces Analysis

This analysis evaluates the competitive forces influencing the optical sorter market.

Supplier Bargaining Power

Medium

Optical components and software suppliers have fair control over pricing.

Buyer Bargaining Power

High

Buyers have high power due to presence of multiple suppliers and low switching costs.

Threat of Substitutes

Low

Low threat as no other technology provides such efficient sorting capabilities.

Threat of New Entrants

Medium

Entry barriers exist due to high capex, but technology advancements may allow new players.

Competitive Rivalry

High

Intense rivalry due to presence of many global and regional players.

Regional Analysis

Geographic market dynamics and growth opportunities across key regions

Global Market Outlook

optical-sorter-market market regional share

North America

In 2024, the North American optical sorter market saw remarkable growth precipitated by several key factors and trends.
Primary drivers of this growth included increasing emphasis on automated waste management systems in the U.S., particularly within manufacturing and retail sectors. Higher investments in R&D fostered the adoption of technologically advanced optical sorters, particularly among food processing industries in Canada. In Mexico, regulatory mandates for efficient waste disposal and recycling promoted use of optical sorting technology, while competitive pricing strategies bolstered supply dynamics across the region.

Trends worth noting include a shift towards AI-enabled optical sorters by major market players, influenced by increased demand for precision and efficiency in sorting operations. A spike was observed in partnerships and M&A activities, especially in the U.S, enhancing service offerings and broadening customer base. Enforcement of stringent sustainability policies became a defining market feature, prompting end-use industries, including mining and utilities, to adopt these systems. In the enterprise sector, the adoption of optical sorters increased due to cost savings and improved operational efficiency. Furthermore, initiatives like America Recycles in the U.S. raised awareness about efficient waste management, further propelling the use of optical sorting technology in the government sector. The state of play in 2024 affirmed the importance of the optical sorter market in North America, with increased adoption registered across various sectors.

Asia Pacific

In 2024, the Optical Sorter Market in the Asia Pacific proved to be vibrant and fast-evolving. Following high demand in China and India for high-speed sorting, global players invested heavily in these regions. In Australia, strict regulations to reduce waste drove demand for optical sorters in the recycling industry, leading to increased adoption rates. Meanwhile, Japan spearheaded technology innovation, introducing Artificial Intelligence-enabled sorters, expediting the sorting process and lifting market competitiveness.

Key consumer behavior trends saw the retail sector in South Korea increasingly switching to optical sorters, primarily driven by the urge for enhanced food safety and waste reduction measures. In Japan and Australia, there was a paradigm shift towards automation in manufacturing, raising demand for optical sorters in particle separation endeavours. China's policy enforcement for waste management led to significant collaborations between the government and M&A with leading tech companies optimizing the use of optical sorters. For instance, India saw increased investment from global food processing companies to cater to the growing local demand, which facilitated accretive technology partnerships. There was also heightened adoption in key ASEAN markets, especially Thailand and Indonesia, marked by an upsurge in industrial expansion and the need for efficient waste management. Overall, the dynamic landscape in the region signaled positive growth for optical sorters in 2024.

Europe

In 2024, Europe's optical sorter market experienced significant expansion due to increased adoption in industries such as food, waste recycling, and minerals. Heightened environmental regulations enforced by EU policy played a key part in driving demand, pushing industries to seek out technologically advanced, eco-friendly solutions for sorting and recycling. Early technology adoption, particularly in Germany and the UK, has contributed to market growth. Key trends included an augmented focus on precision and efficiency. Notably, the United Kingdom displayed a heightened preference for sensor-based optical sorters, while France started making significant investments in machine learning and AI-enabled optical sorters. The Italian market exemplified increased interest in optical sorters that offer grading capabilities, primarily driven by its burgeoning food industry.

There was a marked shift to multi-sensor systems over single-sensor ones in Nordic countries owing to their superior sorting capacities. Belgium, in the Benelux region, witnessed a surge in partnerships between manufacturing companies and tech firms to develop customized optical sorter systems. In Central and Eastern Europe, manufacturers were inclined towards optical sorters with user-friendly interfaces and easy-installation features, mirroring wider consumer preference. This research underlines the substantial momentum gained by optical sorter market across varied industries throughout Europe in 2024, driven by regulatory pressures and the embracement of advanced technologies.

Latin America

In 2024, the Optical Sorter Market in Latin America presented a vibrant landscape of opportunities linked to technological adoption and rising investment. Drivers influencing the market included the implementation of stringent waste management regulations in countries like Brazil and Argentina, prompting industries to adopt advanced sorting technologies. The rising demand for high-quality produce, particularly in Mexico and Chile's agricultural sectors, also spurred investment in optical sorters to ensure product quality and reduce waste. Furthermore, the growing recognition of ecologically sustainable practices in Colombia and Peru amplified the adoption of optical sorting technology, reducing landfill contribution and bolstering recyclable material recovery.

In discussing trends, a notable inclination towards automation and digitalization of operations, particularly in manufacturing and retail sectors in Argentina and Mexico, was evident. The development of AI-powered optical sorting technology that can identify and sort a wide range of products based on color, size, and material type illustrated this shift. Broadening partnerships, such Buhler Group's engagement with recycling companies, reflected the evolving market dynamics. Increased policy enforcement around waste management standards, like Brazil's National Solid Waste Policy (PNRS), also shaped the market climate. The LATAM Optical Sorter Market in 2024 thus demonstrated a robust interplay between regulatory norms, technology adoption, and sustainable practices.

Middle East & Africa

In 2024, the Optical Sorter Market in the Middle East and Africa exhibited significant expansion. Market drivers primarily included the region's rapid modernization where countries like Saudi Arabia, United Arab Emirates and Qatar heavily invested in automation as part of their diversification strategies from oil-based economies. The adoption of optical sorting technologies in rapidly developing industries such as waste management and food processing was notable. Regulations supporting waste minimization and promoting sustainability formed the backbone of this market surge in countries like Egypt and South Africa. Key trends manifested through shifts in buyer behavior prioritized increased efficiency and reduced operational costs. In response, manufacturing sectors adopted innovative sorting technologies, particularly in Israel, which is known for embracing technological advancements. Moreover, partnerships and mergers particularly within the telecom and utilities sector became more prevalent, which fueled the growth of the optical sorter market. Countries' emphasis on policy enforcement reflecting the international standards for waste management and recycling drove the market.

The growth was majorly dominated by the government, manufacturing, and retail sectors, while the healthcare and financial services lagged behind. The oil and gas industry, notably in Nigeria and Kenya, also adopted optical sorting technologies to enhance their operational processes. In 2024, the Optical Sorter Market in the Middle East and Africa illustrated robust growth, influenced by varied economic sectors and driven by technological shifts, regional policies, and investment patterns.

Recent Industry Developments

Latest market innovations, product launches, and strategic initiatives

June 2026

BRT Hartner GmbH and RTT System GmbH launched the BRT Hartner AS Automatic Sorter, an AI-enabled optical sorting platform. The system features a Hyperspectral Imaging (HSI) camera and employs a sensor fusion concept merging NIR, color, 3D, and metal sensor data at the raw data level.

April 2026

Satake announced the global expansion of its SLASH (Model: VQS Series) modular range of compact optical sorters following a successful launch in Japan. The sorter combines visible light with multi-wavelength near-infrared detection and features "Satake Smart Sensitivity" technology that automatically generates calibration curves.

Frequently Asked Questions