Indoor LBS Market Snapshot

Key Players

  • Apple Inc. (United States)
  • Google Inc. (United States)
  • Microsoft Corporation (United States)
  • Qualcomm Inc. (United States)
  • Zebra Technologies Corporation (United States)
  • Cisco Systems Inc. (United States)
  • Ubisense Group Plc. (United Kingdom)
  • STMicroelectronics N.V. (Switzerland)
  • TeleCommunication Systems Inc. (United States)

Market Size

Base Year 2024
$18.26 Bn
CAGR
23.95%
Forecast 2034
$156.30 Bn

Market Segments

By Technology
Ultra-Wideband (UWB), Bluetooth Low Energy (BLE), Wi-Fi, Radio Frequency Identification (RFID), Infrared, Computer Vision
By Deployment Type
On-Premise, Cloud-Based, Hybrid
By Application
Asset Tracking, Navigation & Wayfinding, Proximity Marketing, Safety & Security, Process Optimization, Energy Management, Others
By Industry Vertical
Retail, Healthcare, Manufacturing, Logistics & Transportation, Hospitality, Education, Others

Market Dynamics

Drivers
  • Increased smartphone penetration
  • Rising IoT applications
Restraints
  • High installation cost
  • Privacy concerns
Opportunities
  • Increasing smartphone penetration
  • Rising emphasis on precision marketing

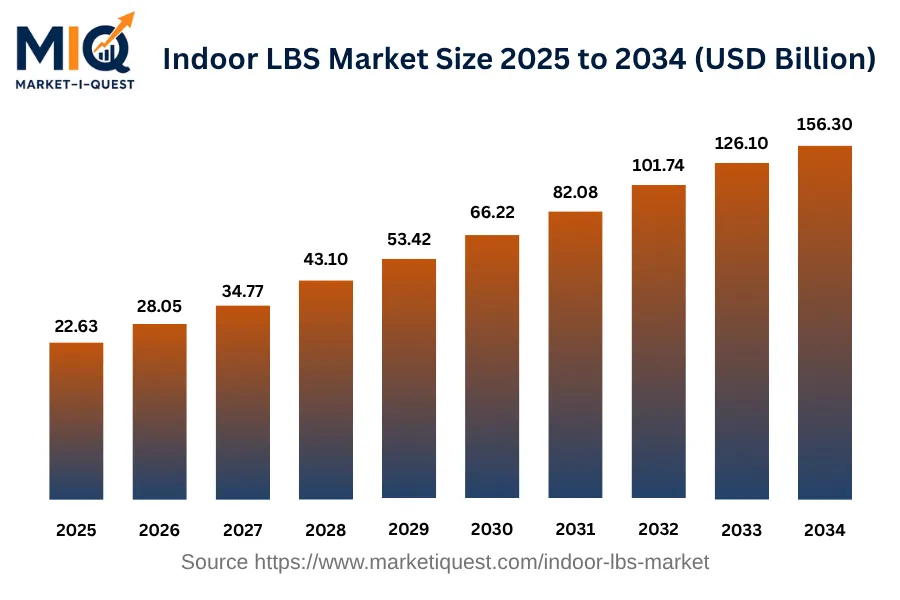
Market Size

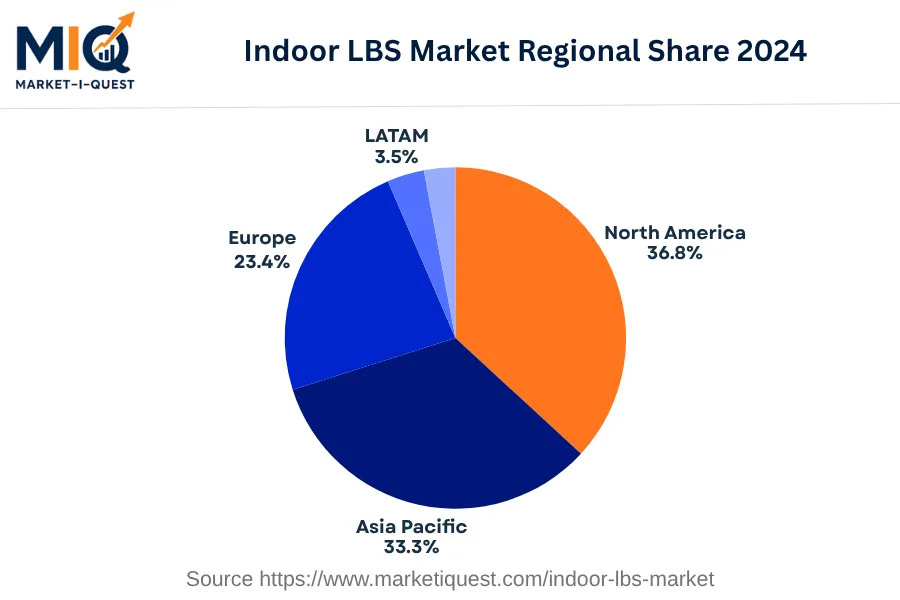
The Indoor LBS Market was valued at USD 22.63 billion in 2025 and is anticipated to reach USD 156.30 billion in 2034, with a Compound Annual Growth Rate (CAGR) of 23.95%. This growth is due to the market progressively expanding from 2025 to 2034 due to increasing demands and adaptation of indoor LBS technologies. The Indoor LBS market saw significant growth, allowing it to reach its robust state in 2034. In terms of regional share in 2024, North America had the highest share in the Indoor LBS Market at 39.16%, followed by Asia Pacific at 32.42%, Europe at 21.14%, LATAM at 3.14%, and the MEA holding the least share at 4.14%.

Key Takeaways

  • By Technology - Wi-Fi led the Indoor LBS Market accounting for a significant share in the base year.
  • By Deployment Type - Cloud-Based solutions held the largest market share in the base year.
  • By Application - Safety & Security dominated accounting for a substantial market share in the base year.
  • By Industry Vertical - Manufacturing led the Indoor LBS Market holding a prominent position in the base year.
indoor-lbs-market market size

Key Driving Factors

Implementation of Smart Building Initiatives

A driving factor for the Indoor LBS Market is the increased implementation of smart building initiatives worldwide that require more sophisticated indoor location-based services. These initiatives rely heavily on the efficiency and specificity of indoor LBS technologies to offer real-time navigation, emergency planning, and todoors as well as to integrate the various technological systems within the buildings. This factor affects predominantly corporate entities and real estate developers looking to enhance user experience, increase operational efficiency, and promote resource conservation in their establishments.

Adoption of Indoor LBS for Enhanced Retail Customer Experience

Another significant factor driving the Indoor LBS Market is the adoption of these services in the retail sector to enhance the overall customer experience. Retail storeowners are prioritizing the use of indoor location-based services to give customers personalized shopping experiences based on their location within the store. For example, offering targeted promotions and product recommendations while a customer is in a specific aisle. This helps in engaging customers, fostering brand loyalty, and ultimately driving sales. Therefore, the current retail transformation trends, where customer experience is pivotal, play a substantial role in propelling the Indoor LBS Market.

Market Evolution by Timeline

2019-2023
During 2019-2023, key buyers of indoor location-based services (LBS) were retailers, manufacturers and hospital administration in countries such as the US, China, and India. Advancements such as micro-location technologies and beacon technology spurred adoption. Google launched 'Project Beacon' to aid businesses with location-based advertising. Catching on this wave, apps like 'Find My Friends' were developed for social purposes. As of 2023, Apple-owned iBeacon was a widely-adopted standard. The typical commercial model was licensing the technology or partnerships with mobile app companies. There were industry concerns regarding privacy and data security, often answered by anonymizing tracked data or implementing strict consent protocols.
2024
By 2024, warehouse management and public safety organizations joined the roster of predominant buyers leveraging the indoor LBS. The supply chain was geared towards providing real-time analytics and personalization based on customer movement patterns within stores. On the policy front, with the advent of GDPR-like rules globally, privacy of data remained a significant concern that influenced companies developing these technologies. As for commercial models, pay-per-use models found increased adoption. In terms of risks, de-anonymizing or data leakage became significant threats that needed to be tackled.
2025-2029
The period 2025-2029 saw a greater adoption of indoor LBS in high-density locations such as airports and stadiums. The emergence of IoT and integration of LBS with automation technologies provided real-time crowd flow information and efficient logistics handling. Policy-wise, the consumer data protection act (CDPA) put emphasis on obtaining explicit consumer consent for location tracking. Companies initiated subscription models, creating a recurring revenue stream. Barriers faced during this period involved high integration cost and technological constraints like interference with other signals or lack of pinpoint accuracy.
2030-2034
During 2030-2034, smart homes and cities were recognized as the leading buyers of Indoor LBS. The technology was shipped with integrated machine learning capabilities enabling predictive analytics and pattern recognition. Companies like Mapsted ventured into indoor navigation without relying on external dependencies like Bluetooth, Wi-Fi, or beacons. Data privacy regulations became stricter, mandating clear disclosure and restricting data usage. Dominant commercial models followed a multi-tiered subscription offering with varying service levels. Signal interference and infrastructural variations causing accuracy issues were addressed by combining multiple positioning technologies.

Future Market Outlook

Future Opportunities

The indoor LBS market is poised for substantial growth opportunities, driven primarily by the increasing implementation of smart building initiatives in commercial real estate. In 2023, the U.S. government announced initiatives aimed at the adoption of smart technologies in public buildings, which likely will enhance the integration of LBS. Enterprises adopting smart IoT devices for energy management and user experience enhancement, as seen in multiple corporate infrastructures across Germany, are looking to leverage indoor positioning data for efficiency gains. Partnerships among tech companies, such as the collaboration between Samsung and Cisco in 2022, indicate a unified strategy for improving LBS capabilities in enterprise environments. Continued emphasis on improving situational awareness in emergency services, highlighted by Qualcomm's 2023 announcement of new technologies designed for first responders, showcases another significant opportunity for tailored solutions. With evolving consumer expectations for seamless navigation experiences, retailers are exploring LBS applications for inventory management, a trend particularly evident in large international chain stores such as Target. In addition, as augmented and virtual reality technologies gain traction, companies are likely to delve into spatial computing, enhancing customer experiences in industries like hospitality and entertainment. The interplay of these advancements and heightened consumer and regulatory expectations will create a fertile environment for new indoor LBS solutions tailored to diverse industry needs.

Segmentation Analysis

By Technology

The technology market is divided into subsegments including Ultra-Wideband (UWB), Bluetooth Low Energy (BLE), Wi-Fi, Radio Frequency Identification (RFID), Infrared, and Computer Vision. Of these, Wi-Fi accounted for the largest revenue share while Bluetooth Low Energy (BLE) is expected to grow at the fastest CAGR during the forecast period.

Largest Revenue Share

Wi-Fi

Market Share Leader

Leading as the subdivision with the largest revenue in the year 2024, Wi-Fi's dominance is driven by its extensive use across numerous sectors. Significant facilitators to this advancement incorporate wide adoption in consumer electronics such as smartphones, desktops, and laptops. Wi-Fi also continues to be a preferred option in home networking systems, making it a staple in households worldwide. Furthermore, enterprise networks across the globe extensively utilize Wi-Fi due to its efficacy in connecting various devices securely and efficiently. Regulatory bodies and governments have allotted frequency bands for Wi-Fi usage, further promoting its growth. The necessity for high-speed data connectivity and the proliferation of the Internet of Things (IoT) has set high demand, keeping purchasing criteria focused on speed and reliability. While alternative technologies emerge, the switching costs and operational disruption continue to favor Wi-Fi’s continued adoption.

Fastest CAGR

Bluetooth Low Energy (BLE)

Forecast Period Growth Leader

While Wi-Fi leads in revenue share, Bluetooth Low Energy (BLE) is expected to outpace all other subdivisions in terms of growth rate. This rapid growth outlook is due to BLE’s power-efficient design making it a practical choice for many battery-operated IoT devices. Its capability to run for long periods on small coin-cell batteries is catalyzing its adoption in numerous fields such as healthcare, fitness, security, and home entertainment systems. However, technical challenges like range limitations and comparatively slower data transfer rates might slow its adoption rate. Policies that advocate energy efficiency, technological advancements, and strategic partnerships among key players potentially stand as catalysts for BLE's rapid growth. On the other hand, high capital expenditure and initial pairing or connection complexities may pose near-term risks.

By Deployment Type

The market is divided into subsegments including On-Premise, Cloud-Based, and Hybrid, wherein Cloud-Based accounted for the largest revenue share, while the Hybrid subsegment is predicted to trailblaze with the fastest CAGR during the forecast period.

Largest Revenue Share

Cloud-Based

Market Share Leader

Cloud-based solutions are generating the highest revenue in the 2024 market, a position they owe, in a large way, to their scalability, flexibility, and cost-effectiveness. These features have made them particularly attractive to small and medium-sized enterprises (SMEs), who represent a significant segment of the market purchasers. The low initial investment and pay-as-you-go pricing models offered by cloud solutions make them more accessible to these businesses in comparison to on-premise solutions. Moreover, geographically, emerging markets in regions such as Asia-Pacific and Africa are quickly adopting cloud-based tools in a bid to leapfrog conventional technology and accelerate digital transformation, boosting revenue generation from these regions. Another key driver is the regulatory environment, where data protection laws mandate data safety measures that are natively fulfilled by reputable cloud solution providers. Lastly, the rise of remote work and the increasing need for collaboration across multiple locations have further enhanced the demand for cloud-based solutions, solidifying their revenue leadership in the market.

Fastest CAGR

Hybrid

Forecast Period Growth Leader

Amid growing data security concerns and increasing cloud adoption, the Hybrid subsegment is forecasted to exhibit the highest growth rate. The core catalyst behind this is the unique advantage of the hybrid approach, which combines the scalability and accessibility of the cloud with the security and control of on-premise solutions. This matches well with the rising demand from businesses and governments, particularly in developed markets, for solutions that can balance security needs with the ability to harness the power of big data, AI, and machine learning. Further potential for growth lies in significant corporate capital expenditures in IT infrastructure for digital transformation initiatives. Collaboration between cloud service providers and on-premise solution vendors is accelerating the growth of hybrid solutions by simplifying integration and deployment challenges. However, near-term risks include technical complexities and potential downtime during transition. Despite these hurdles, the need for robust, flexible, and secure data management makes the Hybrid subsegment a predicted growth leader in this market.

By Application

The market is divided into subsegments including Asset Tracking, Navigation & Wayfinding, Proximity Marketing, Safety & Security, Process Optimization, Energy Management, and Others. Of these, Safety & Security accounted for the largest revenue share while Asset Tracking is expected to grow at the fastest CAGR during the forecast period.

Largest Revenue Share

Safety & Security

Market Share Leader

In 2024, Safety & Security emerged as the subsegment with the highest revenue. This is grounded in the increasing emphasis on public safety and the implementation of security measures in various industries. The rising incidence of property theft, coupled with the need for efficient security solutions, has contributed significantly to the commercialization of this aspect. Moreover, regulatory bodies worldwide have mandated the implementation of safety & security measures, inadvertently propelling this segment's growth. The selection criterion for this subsegment lies not only in its viability as a safety measure but also the added benefit of tracking and control, which contributes to the overall process and operation efficiency. The role of geography in this scenario is also crucial, as developed regions with a high crime rate will naturally invest more in safety & security, driving its demand.

Fastest CAGR

Asset Tracking

Forecast Period Growth Leader

Despite not leading in terms of revenue, Asset Tracking subsegment is poised to register the highest CAGR. Driving this growth are essentially technology catalysts coupled with the rising need for efficient utilization and management of assets. The advent of advanced IoT and AI technologies allows real-time tracking, which greatly enhances process efficiency and minimizes asset loss. Furthermore, capital expenditure in the industry is expected to favor asset tracking solutions to maximize ROI. Adoption barriers, however, persist, primarily due to the initial cost of implementation and a lack of awareness in undeveloped regions. Near-term risks remain in terms of technical glitches and privacy concerns associated with tracking technologies. Yet, partnerships with tech giants and policy-driven regulations favoring asset transparency are likely to propel asset tracking's footprint in the market.

By Industry Vertical

By industry vertical, the market splits into subsegments including Retail, Healthcare, Manufacturing, Logistics & Transportation, Hospitality, Education, and Others. In 2024, the Manufacturing subsegment accounted for the largest revenue share, while the Healthcare subsegment is expected to grow at the fastest CAGR.

Largest Revenue Share

Manufacturing

Market Share Leader

The Manufacturing subsegment leads the market in revenue share due to several key factors. Critical among these is the broad range of applications in this vertical, spanning virtually all product categories. Manufacturing has also benefited from rapid automation advances, transforming traditional production processes into highly efficient ones. This transformation has driven purchasing as companies seek to stay competitive. There are also notable geographical factors, with regions like Asia-Pacific known for its high manufacturing output, thus providing a substantial contribution. Regulatory policies have further benefited the subsegment, with initiatives aimed at promoting advanced manufacturing technologies in various countries. High entry barriers, in terms of technical knowledge and capital, also limit competition, helping established manufacturers maintain their revenues. Additionally, companies tend to stick with their existing manufacturing partners, due to high switching costs in locating and vetting new partners.

Fastest CAGR

Healthcare

Forecast Period Growth Leader

The Healthcare subsegment holds the promise of the fastest CAGR in the near future. Several catalysts are driving this growth perspective. Technological advancements, such as telehealth and artificial intelligence in diagnostics, are revolutionizing healthcare delivery, leading to higher market adoption. Moreover, policy changes, including increased healthcare spending and reforms in many regions, stimulate growth in the sector. Another driver is the aging global population and a rise in chronic diseases, which amplifies demand for healthcare services. On the other hand, barriers to this growth include high capital investment requirements for advanced medical technologies and stringent regulatory frameworks surrounding their use. This, however, paves the way for strategic partnerships with tech companies, further fueling market growth. Despite the near-term risks, like the volatility of regulatory policies and cybersecurity threats to healthcare data, the healthcare subsegment is well-positioned for robust growth.

Competitive Analysis

Key Market Players

Manufacturers / OEMs

Google Inc.
US
Apple Inc.
US
Microsoft Corporation
US

Key Suppliers & Raw Materials

Qualcomm Inc.
US
Broadcom Inc.
US
STMicroelectronics
Switzerland

Distributors, Integrators & Channel Partners

Alcatel-Lucent
France
Cisco Systems
US
Ericsson
Sweden

Porter’s Five Forces Analysis

Analysis of the competitive intensity and attractiveness within the Indoor LBS Market.

Supplier Bargaining Power

Medium

Limited number of technology providers and mapping data sources moderately controls market cost.

Buyer Bargaining Power

High

Numerous Indoor LBS solutions and platforms give buyers significant price negotiation power.

Threat of Substitutes

Medium

Availability of alternative navigation and tracking technologies contain some substitute risk.

Threat of New Entrants

Medium

The need for substantial R&D and mapping data access acts as barriers to entry.

Competitive Rivalry

High

Intense competition among established players and focused start-ups in the Indoor LBS market.

Regional Analysis

Geographic market dynamics and growth opportunities across key regions

Global Market Outlook

indoor-lbs-market market regional share

North America

In 2024, the North American Indoor Location-Based Services (LBS) market saw a significant uptick due to technological advancements and increasing demand for real-time location systems. Factors such as the implementation of LBS in sectors like retail and healthcare, and rising investment in Indoor LBS technology, particularly in the US, drove market growth. Canada also adopted these services predominantly in the public sector operations, underscoring the region's commitment to leveraging technology for enhanced efficiency. A notable trend was the use of Indoor LBS in healthcare, with hospitals adopting technology for emergency response and real-time monitoring. Tech shifts were another driver with Internet of Things (IoT) and Artificial Intelligence (AI) integrations becoming prominent. Partnerships and M&A activities, particularly in the US, signified industry consolidation and strategic alliance-building.

The use of Indoor LBS in retail gained traction for in-store navigation and personalized marketing. Meanwhile, stricter policy enforcement around data privacy impacted operations and required technology providers to comply, thereby altering the market landscape. With further adoption by sectors such as utilities and manufacturing in Mexico, the Indoor LBS infrastructure saw expansion and diversification. Overall, 2024 represented a dynamic year for Indoor LBS across North America, with significant technological uptake, changes in user behavior, and evolving regulatory conditions.

Asia Pacific

In 2024, the Indoor Location-Based Services (LBS) market in the Asia Pacific was a bustling hub of technological innovation and adoption. Key market forces included burgeoning demand from industries such as retail, healthcare, and enterprise for real-time data analytics, regulatory compliance enhancement, and operational efficiency. Increased investments in technology infrastructure, particularly in China and India, coupled with strong government support in South Korea and Japan, further propelled the market. The lowering costs of related technologies, like RFID and IoT, significantly fueled their market penetration.

Market trends were shaped by the rising consumer expectations for personalized customer experience, especially in Australia and larger ASEAN markets, fostering innovative developments in indoor navigation and proximity marketing. There was a noticeable shift towards Bluetooth beacons and Wi-Fi technologies due to their accuracy and cost-effectiveness. Partnerships and M&A activities were predominantly tech-driven, aiming at enhancing technological prowess and data security. Standards setting and policy enforcement were initially led by governments, especially in China and Japan, but private bodies began increasingly contributing. The healthcare sector notably capitalized on this market, leveraging indoor LBS for patient tracking, medical equipment management, and reducing response times. In manufacturing and retail, indoor LBS found numerous applications from shop floor tracking to improving in-store customer engagement, demonstrating Asia Pacific's robust digital transformation journey in 2024.
Europe

In 2024, the European Indoor Location-based Services (LBS) market experienced continued growth spurred by advancements in technology and increased business uptake. The market drivers included increased investment in indoor positioning technology by retail companies aiming to enhance customer experiences and improve in-store logistics. Additionally, the implementation of European Union's E911 regulations mandating indoor location tracking in emergency calls contributed to the market expansion. The increased adoption of IoT in manufacturing plants across regions such as Germany and the United Kingdom played a significant role in pushing the demand for indoor LBS.

In terms of trends, a shift towards adoption of indoor LBS in healthcare facilities in France and Spain was observed for improved asset tracking and patient care. A pronounced practice of merging or partnering between tech companies and retail enterprises emerged, aiming to secure a competitive edge through techno-commercial synergies. Standards for indoor LBS witnessed rigorous enforcement, particularly in Nordic countries, underlining the ongoing commitment towards improved accuracy and reliability. In the enterprise sector, indoor LBS platforms found extensive usage in navigating large office complexes, establishing it as a tool to foster productivity. Overall, the European Indoor LBS market showed a strong trajectory of growth and innovation in 2024.

Latin America

In 2024, the Indoor Location-Based Services (LBS) market in Latin America (LATAM) was significantly marked by the increasing penetration of smartphones and wireless connectivity, along with the need for location-specific data for various business operations. The impact of government initiatives, like Brazil's National IoT Plan, to promote IoT adoption drove the market's development. In addition, increased investment in Indoor LBS technology from enterprises interested in asset tracking and indoor navigation influenced market growth. High-tech adoption by sectors such as retail and healthcare was observed due to their growing dependency on location analytics for improving customer experience and patient care.

Significant trends included the increase in partnerships between Indoor LBS providers and technology companies to enhance solutions, exemplified by companies like Google and Apple extending their location services capabilities. Comprehensive digitalization across commercial sectors, especially in countries like Mexico and Argentina, led businesses to prioritize data-driven strategies, with location-based services playing a vital role. Indoor LBS solutions became indispensable for emergency response services, especially in Colombia and Chile, where the impact is significant due to geographically challenging conditions. Policy enforcement around data privacy raised awareness about safer data practices, shaping the course of the LBS market further. In response, industries like manufacturing, retail, and government employed these services for efficient process flows and enhanced safety standards.

Middle East & Africa

In 2024, the Indoor Location-Based Services (LBS) Market saw significant growth in the Middle East and Africa due to a mix of factors. The implementation of IoT-based technologies by major sectors such as manufacturing, healthcare, and retail underpinned the adoption of Indoor LBS. Additionally, government support in countries such as Saudi Arabia and the United Arab Emirates towards digitization and smart cities initiatives fostered this growth. A surge in investment, particularly in countries like Nigeria and Kenya, fostered the integration of Indoor LBS within various platforms. High demand from the financial services sector further tapped into the supply dynamics, as firms sought more data-driven solutions.

As for 2024 market trends, customer preferences notably pivoted towards Indoor LBS solutions for precise and real-time data. A technology shift was experienced with the advent of 5G connectivity, improving Indoor LBS performance and reliability. Partnerships and M&A activities heightened, particularly in Israel's vibrant tech scene in efforts to enhance Indoor LBS capabilities. Regulatory policies, such as Egypt's data protection law, also affected market trends by framing the safe and ethical use of LBS. In sum, the year 2024 was characterized by a robust adoption and evolution of Indoor LBS in the Middle East and Africa, shaped by technology adoption, regulatory policies, and investment activities.

Recent Industry Developments

Latest market innovations, product launches, and strategic initiatives

January 2026

Indoor location and mapping provider Pointr announced a partnership with Vusion (a digital shelf label and IoT solutions provider) to combine Vusion’s electronic shelf labels with Pointr’s AI-powered indoor maps and location services. The integration helps customers and associates find products and points of interest in stores directly from mobile devices.

June 2025

LocusLabs and IndoorAtlas announced a partnership to integrate IndoorAtlas’ Indoor Positioning System (IPS) with LocusLabs’ digital venue maps and wayfinding solutions. The collaboration created an end-to-end digital wayfinding and map management solution for airports, stadiums, shopping malls, and other large indoor venues.

Frequently Asked Questions